Raster DataFrame / SQL app
Sedona SQL works with raster data alongside vectors. This tutorial walks a single dataset through a complete pipeline — load, inspect, visualize, process, visualize again, save — so you can see what each step produces. Reference material for additional formats, operators, and Python-side workflows follows at the end.
Note
Sedona uses 1-based indexing for all raster functions except map algebra, which uses 0-based indexing.
Note
Sedona assumes geographic coordinates are in longitude/latitude order. If your data is lat/lon, swap axes with ST_FlipCoordinates.
Raster support is available in all Sedona language bindings (Scala, Java, Python, R). Python is the primary language used in the walkthrough; multi-language tabs appear on the key steps.
Set up dependencies
- Read Sedona Maven Central coordinates and add Sedona dependencies in build.sbt or pom.xml.
- Add Apache Spark core and Apache SparkSQL.
- See the SQL example project.
- Follow Quick start to install Sedona Python.
- This tutorial mirrors the structure of the Sedona SQL Jupyter Notebook example.
- The walkthrough synthesizes its input scene with NumPy and rasterio:
pip install numpy rasterio. Real workflows that read existing GeoTIFFs don't need rasterio.
Create a SedonaContext
If you already have a SparkSession (Wherobots, AWS EMR, Databricks), skip ahead and pass it to SedonaContext.create. Otherwise:
import org.apache.sedona.spark.SedonaContext

val config = SedonaContext.builder()
  .master("local[*]") // Delete this line when running on a cluster
  .appName("rasterTutorial")
  .getOrCreate()
val sedona = SedonaContext.create(config)
import org.apache.sedona.spark.SedonaContext;

SparkSession config = SedonaContext.builder()
  .master("local[*]") // Delete this line when running on a cluster
  .appName("rasterTutorial")
  .getOrCreate();
SparkSession sedona = SedonaContext.create(config);
from sedona.spark import SedonaContext

config = (
    SedonaContext.builder()
    .config(
        "spark.jars.packages",
        "org.apache.sedona:sedona-spark-shaded-3.5_2.12:1.9.1,"
        "org.datasyslab:geotools-wrapper:1.9.1-33.5",
    )
    .getOrCreate()
)
sedona = SedonaContext.create(config)
3.5 with the major.minor version of your Spark install (for example sedona-spark-shaded-4.0_2.13).
You can also register Sedona by passing --conf spark.sql.extensions=org.apache.sedona.sql.SedonaSqlExtensions to spark-submit or spark-shell.
End-to-end walkthrough
The walkthrough uses a single 2-band GeoTIFF — red and near-infrared reflectance over a small AOI — and carries it through every stage of a typical raster workflow. The scene is synthesized in Python so the example is fully reproducible and ships no extra bytes. The same SQL runs unchanged against real Sentinel-2 chips; only the input path changes.
What real rasters look like
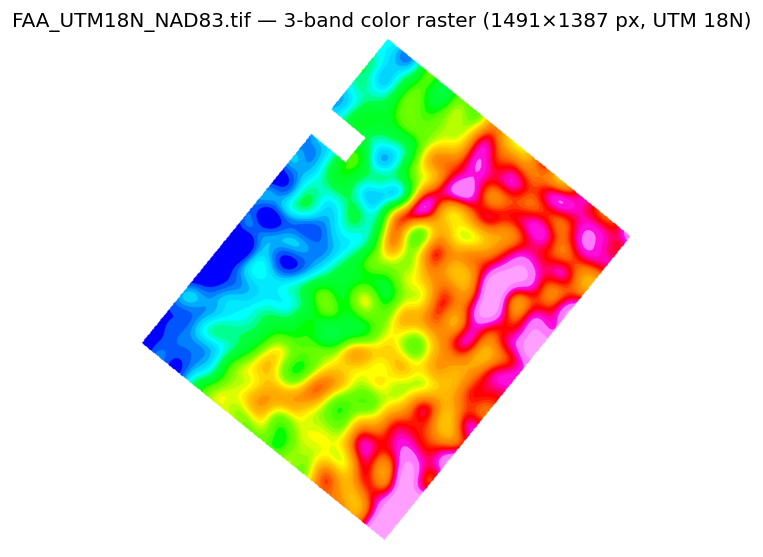
The same code paths handle anything the GeoTIFF spec supports. Two examples from Sedona's own test resources:
| 3-band color raster | Single-band raster |
|---|---|
 |
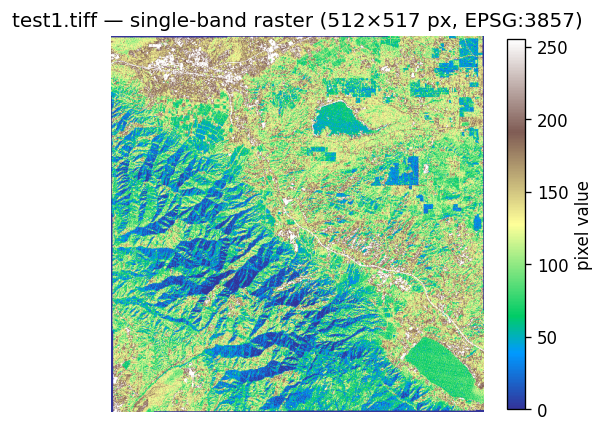 |
RS_NumBands(rast) would return 3 and 1 respectively. Band-level functions like RS_Band(rast, ARRAY(1,2,3)) and RS_MapAlgebra work the same way on both.
1. Create the input scene
Synthesize a 256 × 256 raster with a circular vegetated field. Real workflows skip this step and point Sedona at existing GeoTIFFs on disk or in object storage.
import os
import numpy as np
import rasterio
from rasterio.transform import from_bounds

WORK = "/tmp/sedona-raster-tutorial"
os.makedirs(WORK, exist_ok=True)

AOI = (-91.10, 41.50, -91.00, 41.60)  # xmin, ymin, xmax, ymax in EPSG:4326
W = H = 256
transform = from_bounds(*AOI, W, H)
rng = np.random.default_rng(42)

ys, xs = np.mgrid[0:H, 0:W]
field = ((xs - 96) ** 2 + (ys - 160) ** 2) < 60**2  # circular vegetated field

red = (1500 + 200 * rng.standard_normal((H, W))).clip(0, 10000).astype("uint16")
nir = (1800 + 200 * rng.standard_normal((H, W))).clip(0, 10000)
nir = np.where(field, nir + 4000, nir).astype("uint16")

with rasterio.open(
    f"{WORK}/scene.tif",
    "w",
    driver="GTiff",
    tiled=True,
    blockxsize=256,
    blockysize=256,
    height=H,
    width=W,
    count=2,
    dtype="uint16",
    crs="EPSG:4326",
    transform=transform,
) as dst:
    dst.write(red, 1)
    dst.set_band_description(1, "red")
    dst.write(nir, 2)
    dst.set_band_description(2, "nir")
2. Load with the raster data source
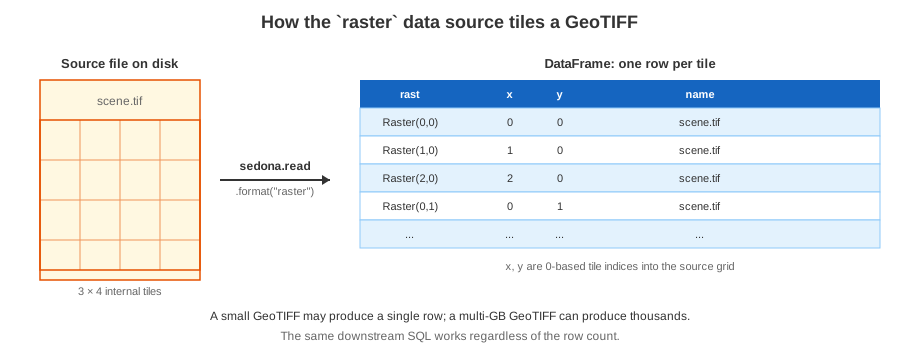
The raster data source loads GeoTIFFs and automatically splits each file into tiles. Every tile becomes a row in a DataFrame with a Raster-typed column.
// Replace the path with wherever scene.tif lives, e.g. an object-store URL.
val rasterDf = sedona.read.format("raster").load("/tmp/sedona-raster-tutorial/scene.tif")
rasterDf.createOrReplaceTempView("rasterDf")
rasterDf.show()
// Replace the path with wherever scene.tif lives, e.g. an object-store URL.
Dataset<Row> rasterDf = sedona.read().format("raster").load("/tmp/sedona-raster-tutorial/scene.tif");
rasterDf.createOrReplaceTempView("rasterDf");
rasterDf.show();
rasterDf = sedona.read.format("raster").load(f"{WORK}/scene.tif")
rasterDf.createOrReplaceTempView("rasterDf")
rasterDf.show()
+--------------------+---+---+----------+
|                rast|  x|  y|      name|
+--------------------+---+---+----------+
|GridCoverage2D["g...|  0|  0| scene.tif|
+--------------------+---+---+----------+
The columns are:
rast— the raster, in Sedona'sRastertype.x,y— the 0-based tile index inside the source file (present when tiling is enabled).name— the source filename.
The 256 × 256 scene fits in a single tile here, so you get one row. A multi-gigabyte GeoTIFF would yield many rows — the same downstream SQL works in both cases.
Before loading a collection, use the file metadata readers to inspect and filter GeoTIFF or NetCDF files without decoding their raster data. The remaining loading options cover tile-size overrides, recursive directory globs, and non-GeoTIFF formats such as NetCDF and Arc Grid.
3. Inspect loaded raster metadata
After loading, confirm pixel dimensions, georeference, and CRS before processing:
sedona.sql("""
    SELECT RS_Width(rast)       AS width,
           RS_Height(rast)      AS height,
           RS_NumBands(rast)    AS bands,
           RS_SRID(rast)        AS srid,
           RS_GeoReference(rast) AS world_file
    FROM rasterDf
""").show(truncate=False)
+-----+------+-----+----+----------------------------------------------------------+
|width|height|bands|srid|world_file                                                 |
+-----+------+-----+----+----------------------------------------------------------+
|256  |256   |2    |4326|0.000391\n0.000000\n0.000000\n-0.000391\n-91.099805\n41.599805|
+-----+------+-----+----+----------------------------------------------------------+
RS_MetaData returns the same information as a single array: [upperLeftX, upperLeftY, width, height, scaleX, scaleY, skewX, skewY, srid, numBands].
The georeference fields define an affine transform from pixel space to world space:
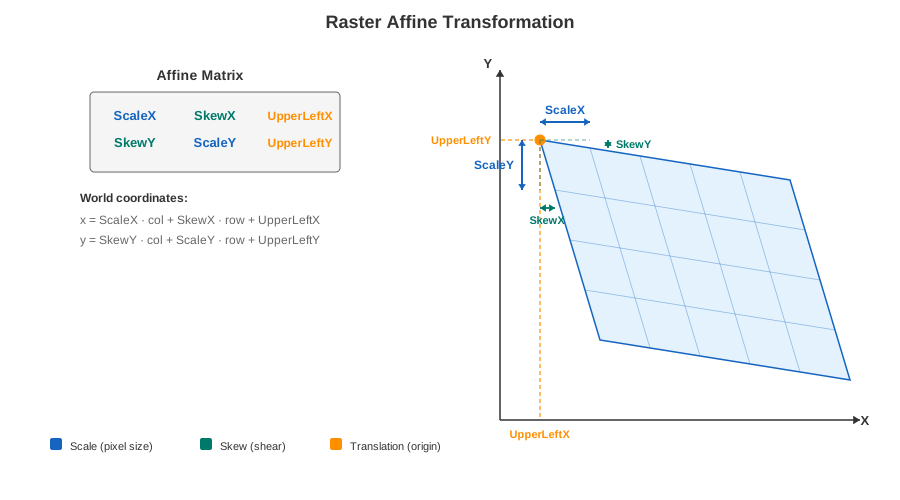
See Raster metadata for every accessor and RS_PixelAsPoint / RS_WorldToRasterCoord for the runtime conversions.
4. Visualize the raw raster
Render the two bands so you can see the input before any processing. SedonaUtils.display_image auto-detects raster columns inside a Jupyter notebook and renders them inline:
from sedona.spark import SedonaUtils

SedonaUtils.display_image(
    sedona.sql("SELECT RS_Band(rast, ARRAY(1)) AS rast FROM rasterDf")
)
SedonaUtils.display_image(
    sedona.sql("SELECT RS_Band(rast, ARRAY(2)) AS rast FROM rasterDf")
)
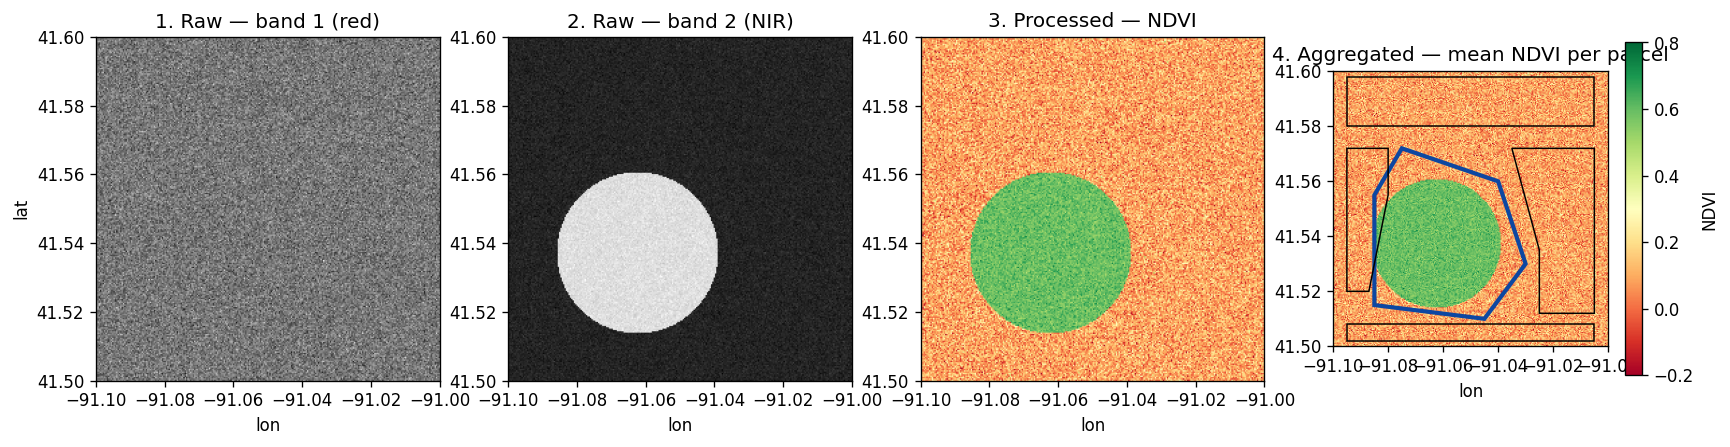
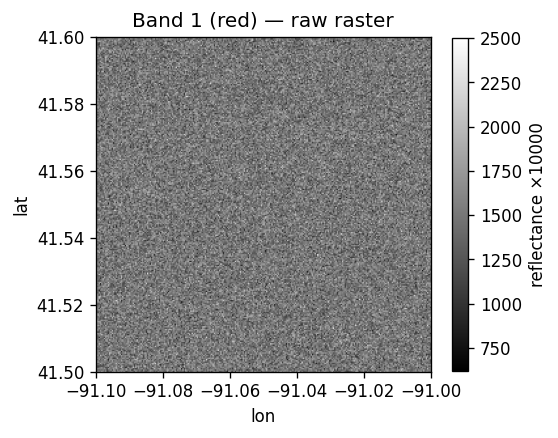
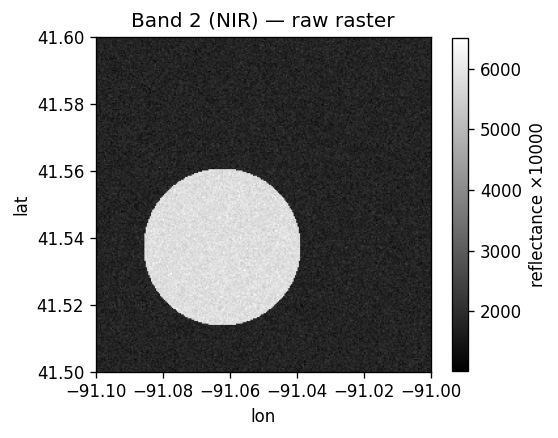
Band 1 is the red channel — mostly featureless bare ground. Band 2 (NIR) lights up over the vegetated field:
| Band 1 (red) | Band 2 (NIR) |
|---|---|
 |
 |
Outside a notebook, use RS_AsImage(rast, width) to get an HTML <img> tag, or RS_AsBase64 for a Base64 string that any image viewer can decode.
5. Process — compute NDVI with map algebra
The Normalized Difference Vegetation Index isolates live vegetation:
NDVI = (NIR − Red) / (NIR + Red)
RS_MapAlgebra runs a per-pixel script over one or more bands. Output type 'D' (double) preserves the negative side of the NDVI range:
ndviDf = sedona.sql("""
    SELECT RS_MapAlgebra(
               rast, 'D',
               'out[0] = (rast[1] - rast[0]) / (rast[1] + rast[0] + 1e-6);'
           ) AS rast
    FROM rasterDf
""")
ndviDf.createOrReplaceTempView("ndviDf")
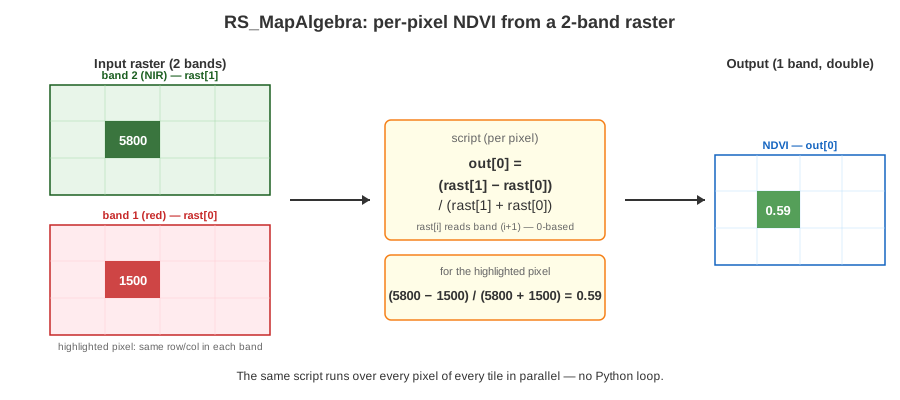
Map algebra is the most general processing primitive — clipping, masking, thresholding, and arithmetic between bands or between rasters all fit the same RS_MapAlgebra(rast, pixelType, script) (or two-raster) shape. See Map algebra for the script syntax and Raster processing below for alternatives (RS_Clip, RS_Resample, RS_SetValues).
Warning
RS_MapAlgebra is deprecated since v1.9.1 and will be removed in a future version, in favour of
Raster UDFs, which express the same per-pixel calculations in Python and
additionally reach NumPy, SciPy, scikit-learn, and rasterio. It still works, so this walkthrough runs as
written, but new code should use a UDF — see
NDVI as map algebra and as a UDF for the
same calculation written both ways.
6. Visualize the processed raster
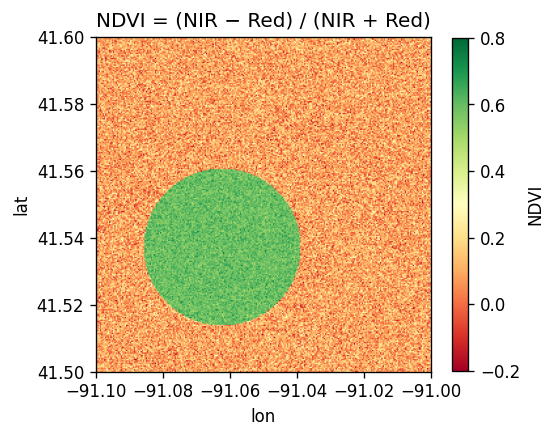
The NDVI raster makes the vegetated field obvious: green pixels where NDVI is high, washed-out red elsewhere.
SedonaUtils.display_image(ndviDf)
7. Aggregate to vector zones with zonal stats
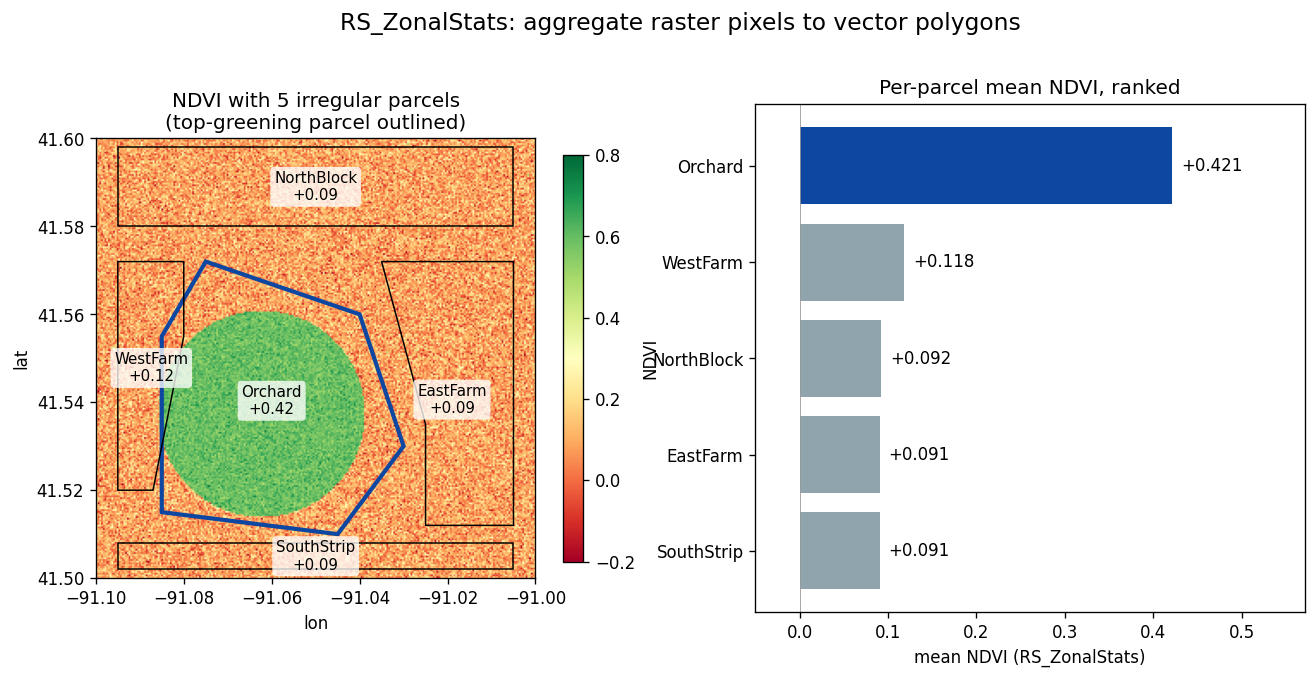
NDVI per pixel is rarely the deliverable. The question is usually "which area greened up?" — which farm parcel, census block, or watershed. RS_ZonalStats(raster, zone, statType) is the canonical raster → vector aggregation: every pixel that falls inside a zone polygon contributes to the statistic.
Real parcel boundaries are irregular — odd-shaped fields, road easements between them, gaps that aren't part of any zone. Define five hand-drawn parcels over the AOI:
from pyspark.sql import Row

parcels = sedona.createDataFrame(
    [
        Row(
            parcel_id="Orchard",
            wkt="POLYGON((-91.085 41.515, -91.045 41.510, -91.030 41.530, "
            "-91.040 41.560, -91.075 41.572, -91.085 41.555, -91.085 41.515))",
        ),
        Row(
            parcel_id="EastFarm",
            wkt="POLYGON((-91.025 41.512, -91.005 41.512, -91.005 41.572, "
            "-91.035 41.572, -91.025 41.535, -91.025 41.512))",
        ),
        Row(
            parcel_id="WestFarm",
            wkt="POLYGON((-91.095 41.520, -91.087 41.520, -91.080 41.555, "
            "-91.080 41.572, -91.095 41.572, -91.095 41.520))",
        ),
        Row(
            parcel_id="NorthBlock",
            wkt="POLYGON((-91.095 41.580, -91.005 41.580, -91.005 41.598, "
            "-91.095 41.598, -91.095 41.580))",
        ),
        Row(
            parcel_id="SouthStrip",
            wkt="POLYGON((-91.095 41.502, -91.005 41.502, -91.005 41.508, "
            "-91.095 41.508, -91.095 41.502))",
        ),
    ]
).selectExpr("parcel_id", "ST_GeomFromText(wkt) AS geom")

parcels.createOrReplaceTempView("parcels")

ranked = sedona.sql("""
    SELECT p.parcel_id,
           ROUND(RS_ZonalStats(n.rast, p.geom, 'mean'), 4) AS mean_ndvi
    FROM parcels p, ndviDf n
    ORDER BY mean_ndvi DESC
""")
ranked.show()
+----------+---------+
| parcel_id|mean_ndvi|
+----------+---------+
|   Orchard|   0.4213|
|  WestFarm|   0.1182|
|NorthBlock|   0.0925|
|  EastFarm|   0.0907|
|SouthStrip|   0.0905|
+----------+---------+
The irregular Orchard parcel wins decisively — that's the polygon that overlaps the vegetated field. Pixels in the gaps between parcels (roads, untracked land) contribute to no zone and don't affect any statistic.
Note
With a tiled input, the parcels × ndviDf cross-join produces one row per (parcel, tile). To aggregate properly across tiles, compute per-tile sum and count and roll them up: SUM(sum) / SUM(count) GROUP BY parcel_id. Same idiom, one extra aggregation. RS_ZonalStatsAll returns every standard statistic in a single call.
8. Save back to disk
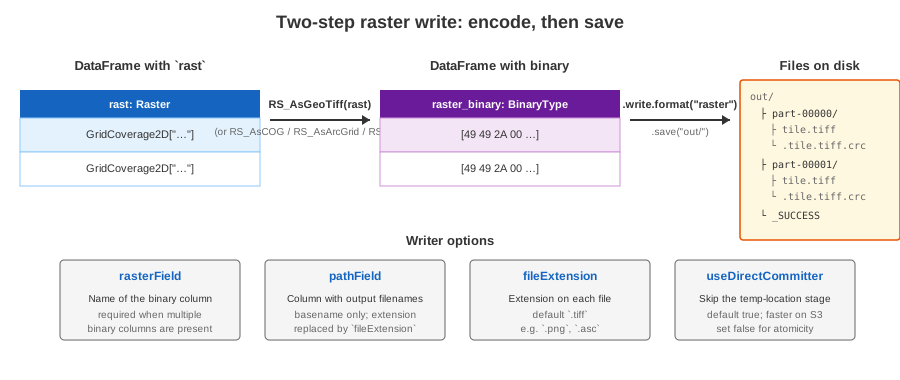
Writing is a two-step pattern: convert the Raster column to a binary format with RS_AsXXX, then hand the binary DataFrame to Sedona's raster writer.
import org.apache.spark.sql.functions.expr

ndviDf.withColumn("raster_binary", expr("RS_AsGeoTiff(rast)"))
  .write.format("raster").mode("overwrite").save("/tmp/sedona-raster-tutorial/ndvi_out")
from pyspark.sql.functions import expr

(
    ndviDf.withColumn("raster_binary", expr("RS_AsGeoTiff(rast)"))
    .write.format("raster")
    .mode("overwrite")
    .save(f"{WORK}/ndvi_out")
)
The output directory contains one file per partition row plus Spark's _SUCCESS marker. To read it back:
roundtrip = sedona.read.format("raster").load(f"{WORK}/ndvi_out/*/*.tiff")
roundtrip.selectExpr("RS_Width(rast) AS w", "RS_Height(rast) AS h").show()
See Writing rasters for the full set of writer options (rasterField, pathField, fileExtension, useDirectCommitter) and the binary-format choices (RS_AsGeoTiff, RS_AsCOG, RS_AsArcGrid, RS_AsPNG).
The rest of this page is reference material: additional load patterns, every raster operator grouped by purpose, and Python-side workflows for collected SedonaRaster objects.
Loading options
Inspect and filter files before loading
Loading raster cells is usually more expensive than reading file metadata. The
geotiff.metadata data source and
netcdf.metadata data source return one row
per file without loading its raster data arrays. Use them to quickly inspect raw
files, filter a collection by properties such as spatial extent, CRS, dimensions,
bands, or variables, and then load only the selected paths.
metadata = sedona.read.format("geotiff.metadata").load("/data/imagery/")
metadata.select(
    "path", "width", "height", "numBands", "srid", "compression"
).show(truncate=False)

selected = metadata.where("srid = 4326 AND numBands >= 3").select("path")
selected_paths = [row.path for row in selected.collect()]
rasterDf = sedona.read.format("raster").load(selected_paths)
metadata = sedona.read.format("netcdf.metadata").load("/data/climate/")
metadata.select(
    "path", "format", "width", "height", "srid", "variables"
).show(truncate=False)

# Select only files that contain the record variable needed downstream.
selected = metadata.where(
    "exists(variables, v -> v.name = 'O3')"
).select("path")
selected_paths = [row.path for row in selected.collect()]
rawDf = sedona.read.format("binaryFile").load(selected_paths)
rasterDf = rawDf.selectExpr("path", "RS_FromNetCDF(content, 'O3') AS rast")
The examples collect only the filtered path strings on the driver; the raster cells
remain unread until the final raster or binaryFile scan. For very large selections,
organize source files into partitions or path patterns so the selected inputs can be
expressed without collecting a large path list.
Tile-size overrides
By default the raster data source uses the GeoTIFF's internal tile scheme. Cloud Optimized GeoTIFFs (COGs) are the recommended source format because they already organize pixels in square tiles. To override tiling explicitly:
| Option | Default | Description |
|---|---|---|
retile |
true |
Whether to tile. Set to false to load each file as a single row. |
tileWidth |
source's internal tile width | Override the width of each tile, in pixels. |
tileHeight |
same as tileWidth if set |
Override the height of each tile, in pixels. |
padWithNoData |
false |
Pad the right/bottom edge tiles with NODATA when smaller than the tile size. |
rasterDf = (
    sedona.read.format("raster")
    .option("tileWidth", "256")
    .option("tileHeight", "256")
    .load("/some/path/*.tif")
)
Note
If a file's internal layout isn't tile-friendly, the data source raises an error. Either disable retiling with option("retile", "false"), set tile dimensions explicitly, or rewrite the file as a COG with gdal_translate.
Loading directories and globs
The raster data source accepts Spark's generic file-source options:
rasterDf = (
    sedona.read.format("raster")
    .option("recursiveFileLookup", "true")
    .option("pathGlobFilter", "*.tif*")
    .load("/path/to/raster_folder")
)
Tip
A trailing / on the load path enables recursive lookup automatically — equivalent to setting recursiveFileLookup=true.
Non-GeoTIFF formats (NetCDF, Arc Grid)
For formats outside GeoTIFF, use Spark's binaryFile source plus a Sedona raster constructor.
rawDf = sedona.read.format("binaryFile").load("/path/to/file.asc")
rawDf.createOrReplaceTempView("rawdf")
Then promote the content column to a Raster:
| Constructor | Source format |
|---|---|
RS_FromGeoTiff(content) |
GeoTIFF (also loadable via the raster source above) |
RS_FromArcInfoAsciiGrid(content) |
Arc Info ASCII Grid |
RS_FromNetCDF(...) |
NetCDF |
SELECT RS_FromArcInfoAsciiGrid(content) AS rast,
       modificationTime, length, path
FROM rawdf
Raster metadata reference
| Function | Returns |
|---|---|
RS_MetaData(rast) |
All fields above as a single array |
RS_Width(rast), RS_Height(rast) |
Pixel dimensions |
RS_NumBands(rast) |
Band count |
RS_SRID(rast) |
Coordinate reference system (EPSG code) |
RS_GeoReference(rast, format) |
World file (GDAL or ESRI flavor) |
RS_UpperLeftX(rast), RS_UpperLeftY |
Upper-left world coordinates |
RS_ScaleX(rast), RS_ScaleY |
Pixel size in world units |
Raster processing reference
The walkthrough used RS_MapAlgebra for NDVI. The full operator surface:
Coordinate translation
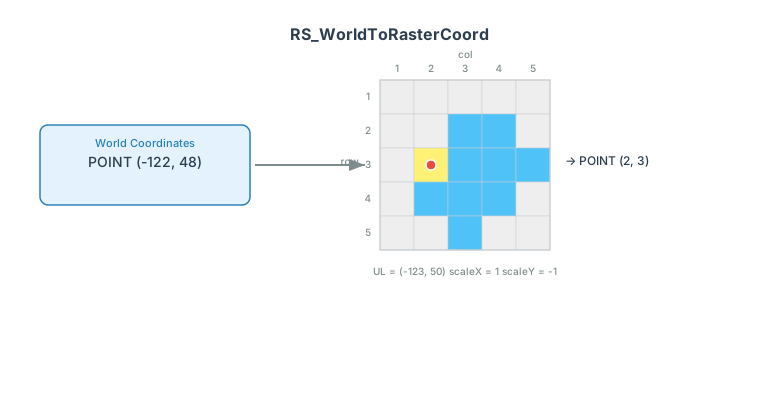
RS_PixelAsPoint(rast, col, row)— pixel → world.RS_WorldToRasterCoord(rast, x, y)— world → pixel (useRS_WorldToRasterCoordX/Yfor a single axis).
Pixel manipulation
RS_Values(rast, points)— sample pixel values at an array of points.RS_SetValues(rast, band, x, y, width, height, values)— overwrite a rectangular block.
Band manipulation
RS_Band(rast, bands)— select a subset of bands.RS_AddBand(target, source, srcBand, dstBand)— copy a band between rasters.
Resampling and clipping
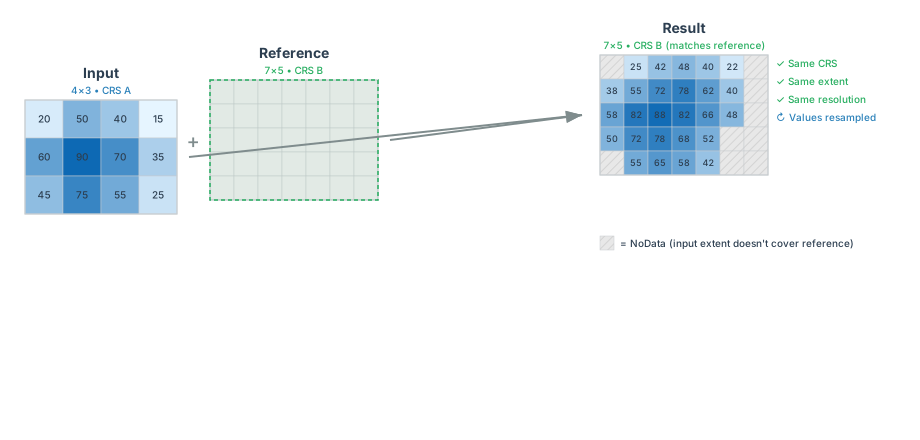
RS_Resample(rast, scaleX, scaleY, gridX, gridY, useScale, method)— change cell size or align to a target grid using nearest-neighbor, bilinear, or bicubic interpolation.RS_Clip(rast, band, geom)— crop to a polygon.RS_ReprojectMatch— resample one raster onto another raster's grid and CRS:
Per-pixel calculations
Use a Raster UDF. A UDF takes one raster column or several, so both shapes of the
deprecated RS_MapAlgebra have a direct equivalent — here is the two-raster change-detection case:
import numpy as np
from pyspark.sql.functions import col, udf

from sedona.spark.sql.types import RasterType

NODATA = -9999.0


@udf(returnType=RasterType())
def delta(after, before):
    # as_numpy_masked(), not as_numpy(): NODATA becomes NaN and stays invalid through
    # the subtraction instead of contributing its sentinel value.
    diff = after.as_numpy_masked()[0] - before.as_numpy_masked()[0]
    return after.with_bands(np.where(np.isnan(diff), NODATA, diff), nodata=NODATA)


# ndvi_after and ndvi_before are NDVI rasters for two dates, tiled on the same grid,
# each with the x and y tile-index columns the raster data source adds.
(
    ndvi_after.alias("after")
    .join(ndvi_before.alias("before"), ["x", "y"])
    .select(delta(col("after.rast"), col("before.rast")).alias("delta"))
)
See Raster UDFs for the single-raster form, NDVI written both ways, and the limits to be aware of.
Raster–vector interop
Rasterize a geometry
RS_AsRaster renders a vector geometry into a raster grid:
SELECT RS_AsRaster(
    ST_GeomFromWKT('POLYGON((150 150, 220 260, 190 300, 300 220, 150 150))'),
    RS_MakeEmptyRaster(1, 'b', 4, 6, 1, -1, 1),
    'b', false, 230, 0
)

Spatial filter and join
Raster predicates work in both WHERE clauses and as join conditions:
-- Range query: keep tiles that touch the AOI
SELECT rast FROM rasterDf
WHERE RS_Intersects(rast, ST_GeomFromWKT('POLYGON((0 0, 0 10, 10 10, 10 0, 0 0))'))

-- Spatial join: pair each tile with the vector features that overlap it
SELECT r.rast, g.geom
FROM rasterDf r JOIN geomDf g ON RS_Intersects(r.rast, g.geom)
RS_Intersects and the other raster predicates test against the raster's spatial envelope.
Zonal statistics
The walkthrough used RS_ZonalStats(raster, zone, statType) with 'mean'. The same function supports 'sum', 'count', 'min', 'max', and 'stddev'. To get the full statistical summary in one call, use RS_ZonalStatsAll, which returns a struct of all statistics per zone.
Visualization reference
Beyond SedonaUtils.display_image and RS_AsImage (used in the walkthrough):
RS_AsBase64(rast)— encode as a Base64 string for embedding or online decoding.RS_AsMatrix(rast)— render the underlying pixel grid as a text matrix (useful for tiny rasters or debugging).
See Raster output functions for the full list.
Writing rasters reference
The two-step write pattern from the walkthrough works with four output formats:
| Function | Format | Use case |
|---|---|---|
RS_AsGeoTiff |
GeoTIFF | General-purpose, optional compression |
RS_AsCOG |
Cloud Optimized GeoTIFF | Object storage with efficient range reads |
RS_AsArcGrid |
Arc Info ASCII Grid | Single-band, text-based |
RS_AsPNG |
PNG | Display-only, unsigned-integer pixel types |
The raster writer accepts these options:
| Option | Default | Description |
|---|---|---|
rasterField |
last binary column in the schema |
Name of the binary column to write. Set explicitly when there are multiple binary columns. |
fileExtension |
.tiff |
Output extension (e.g., .png, .asc). |
pathField |
none | Column that supplies the output file name. The basename is used; any extension is replaced by fileExtension. If unset, each file gets a random UUID. |
useDirectCommitter |
true |
Write directly to the target. Set false to stage in a temp location first (slower on S3 and other object stores). |
Example using every option:
import org.apache.spark.sql.functions.expr

rasterDf.withColumn("raster_binary", expr("RS_AsGeoTiff(rast)"))
  .write.format("raster")
  .option("rasterField", "raster_binary")
  .option("pathField", "name")
  .option("fileExtension", ".tiff")
  .mode("overwrite")
  .save("my_raster_file")
from pyspark.sql.functions import expr

(
    rasterDf.withColumn("raster_binary", expr("RS_AsGeoTiff(rast)"))
    .write.format("raster")
    .option("rasterField", "raster_binary")
    .option("pathField", "name")
    .option("fileExtension", ".tiff")
    .mode("overwrite")
    .save("my_raster_file")
)
Output layout:
my_raster_file
├── part-00000-…-c000
│   ├── test1.tiff
│   └── .test1.tiff.crc
├── part-00001-…-c000
│   ├── test2.tiff
│   └── .test2.tiff.crc
└── _SUCCESS
Read it back with the same raster data source:
rasterDf = sedona.read.format("raster").load("my_raster_file/*/*.tiff")
Working with raster DataFrames in Python
Since v1.6.0 you can collect raster DataFrames to the Python driver and operate on them locally. Collected raster cells become SedonaRaster objects.
Tip
For quick Jupyter visualization, prefer SedonaUtils.display_image(df) — no collection needed.
df_raster = (
    sedona.read.format("raster").option("retile", "false").load("/path/to/raster.tif")
)
rows = df_raster.collect()
raster = rows[0].rast
raster  # <sedona.raster.sedona_raster.InDbSedonaRaster at 0x…>
SedonaRaster exposes metadata as Python attributes:
raster.width
raster.height
raster.affine_trans
raster.crs_wkt
Pixel data is available as a NumPy array (CHW order):
raster.as_numpy()  # ndarray
raster.as_numpy_masked()  # ndarray with NODATA masked to NaN
For interop with rasterio (>= 1.2.10):
ds = raster.as_rasterio()  # rasterio.DatasetReader
band1 = ds.read(1)
Python UDFs over rasters
Python UDFs receive raster data, process it with NumPy / SciPy / scikit-learn / etc., and return either a scalar value or a new raster. This section is an introduction; see Raster UDFs for the full treatment, including when to prefer a UDF over RS_MapAlgebra, two-raster UDFs, and the limits to be aware of.
Raster to scalar
UDFs can take SedonaRaster inputs and return any Spark data type. Mean of a raster:
from pyspark.sql.types import DoubleType


def mean_udf(raster):
    return float(raster.as_numpy().mean())


sedona.udf.register("mean_udf", mean_udf, DoubleType())
df_raster.withColumn("mean", expr("mean_udf(rast)")).show()
+--------------------+------------------+
|                rast|              mean|
+--------------------+------------------+
|GridCoverage2D["g...|1542.8092886117788|
+--------------------+------------------+
Raster to raster
Since v1.9.1, UDFs can also return raster objects. Use SedonaRaster.with_bands() to replace pixel data while carrying over the source raster's CRS and affine transform. Band count and dtype can change freely.
import numpy as np
from sedona.spark.sql.types import RasterType


def mask_udf(raster):
    # assumes a hole-free scene; use as_numpy_masked() if it may carry NODATA —
    # see the Raster UDF page
    band1 = raster.as_numpy()[0, :, :]
    mask = (band1 < 1400).astype(np.float32)
    return raster.with_bands(mask)  # 1 band, on the input's grid


sedona.udf.register("mask_udf", mask_udf, RasterType())
df_raster.withColumn("mask_rast", expr("mask_udf(rast)")).show()
+--------------------+--------------------+
|                rast|           mask_rast|
+--------------------+--------------------+
|GridCoverage2D["g...|GridCoverage2D["g...|
+--------------------+--------------------+
with_bands() accepts a NumPy array in CHW order (bands × height × width), or HW order (height × width) for single-band output. The returned SedonaRaster is serialized back to the JVM automatically when the UDF returns, so the output is an ordinary raster column.
Output NODATA is inherited from the input band unless you say otherwise, which is rarely what a derived raster wants — pass nodata= to set it:
return raster.with_bands(mask, nodata=-9999.0)
Note
The result always sits on the input's grid — with_bands() requires the same height and width and reuses the input's CRS and affine transform, so reprojection and resampling can't be done inside a Python UDF. See Raster UDFs for that and the dtype caveats.
Using rasterio inside a UDF
as_rasterio() works inside a UDF too, so rasterio and GDAL algorithms apply to raster columns directly. The dataset is read-only — to return a raster, pass the resulting array through with_bands():
import rasterio.fill


def fill_udf(raster):
    # The GDAL dataset does not carry Sedona's NODATA, so build the mask from the
    # SedonaRaster instead — as_numpy_masked() substitutes NaN for NODATA.
    nodata = raster.bands_meta[0].nodata
    valid = ~np.isnan(raster.as_numpy_masked()[0])
    with raster.as_rasterio() as src:
        filled = rasterio.fill.fillnodata(src.read(1), mask=valid.astype(np.uint8))
    # fillnodata only reaches max_search_distance (100 px) from valid data; deeper
    # cells keep the sentinel, so keep the NODATA declared. Use nodata=float("nan")
    # only when every hole is small enough to be filled completely.
    return raster.with_bands(filled, nodata=nodata)


sedona.udf.register("fill_udf", fill_udf, RasterType())
df_raster.withColumn("filled", expr("fill_udf(rast)")).show()
This works for any rasterio operation that leaves the grid unchanged. Warping and reprojection change the grid and so can't be returned this way — use RS_Resample or RS_ReprojectMatch instead.
Performance
For large raster datasets, see storing raster geometries in Parquet format for recommendations on partitioning and persistence.