Raster operators
Pixel Functions
RS_PixelAsCentroid
Introduction: Returns the centroid (point geometry) of the specified pixel's area.
The pixel coordinates specified are 1-indexed.
If colX and rowY are out of bounds for the raster, they are interpolated assuming the same skew and translate values.
Format: RS_PixelAsCentroid(raster: Raster, colX: Integer, rowY: Integer)
Since: v1.5.0
SQL Example
SELECT ST_AsText(RS_PixelAsCentroid(RS_MakeEmptyRaster(1, 12, 13, 134, -53, 9), 3, 3))
Output:
POINT (156.5 -75.5)
RS_PixelAsCentroids
Introduction: Returns a list of the centroid point geometry, the pixel value and its raster X and Y coordinates for each pixel in the raster at the specified band. Each centroid represents the geometric center of the corresponding pixel's area.
Format: RS_PixelAsCentroids(raster: Raster, band: Integer)
Since: v1.5.1
SQL Example
SELECT ST_AsText(RS_PixelAsCentroids(raster, 1)) from rasters
Output:
[[POINT (-13065222 4021263.75),148.0,0,0], [POINT (-13065151 4021263.75),123.0,0,1], [POINT (-13065077 4021263.75),99.0,1,0], [POINT (-13065007 4021261.75),140.0,1,1]]
Spark SQL example for extracting Point, value, raster x and y coordinates:
val pointDf = sedona.read...
val rasterDf = sedona.read.format("binaryFile").load("/some/path/*.tiff")
var df = sedona.read.format("binaryFile").load("/some/path/*.tiff")
df = df.selectExpr("RS_FromGeoTiff(content) as raster")

df.selectExpr(
  "explode(RS_PixelAsCentroids(raster, 1)) as exploded"
).selectExpr(
  "exploded.geom as geom",
  "exploded.value as value",
  "exploded.x as x",
  "exploded.y as y"
).show(3)
Output:
+----------------------------------------------+-----+---+---+
|geom                                          |value|x  |y  |
+----------------------------------------------+-----+---+---+
|POINT (-13095781.835693639 4021226.5856936392)|0.0  |1  |1  |
|POINT (-13095709.507080918 4021226.5856936392)|0.0  |2  |1  |
|POINT (-13095637.178468198 4021226.5856936392)|0.0  |3  |1  |
+----------------------------------------------+-----+---+---+
RS_PixelAsPoint
Introduction: Returns a point geometry of the specified pixel's upper-left corner. The pixel coordinates specified are 1-indexed.
Note
If the pixel coordinates specified do not exist in the raster (out of bounds), RS_PixelAsPoint throws an IndexOutOfBoundsException.
Format: RS_PixelAsPoint(raster: Raster, colX: Integer, rowY: Integer)
Since: v1.5.0
SQL Example
SELECT ST_AsText(RS_PixelAsPoint(raster, 2, 1)) from rasters
Output:
POINT (123.19, -12)
SQL Example
SELECT ST_AsText(RS_PixelAsPoint(raster, 6, 2)) from rasters
Output:
IndexOutOfBoundsException: Specified pixel coordinates (6, 2) do not lie in the raster
RS_PixelAsPoints
Introduction: Returns a list of the pixel's upper-left corner point geometry, the pixel value and its raster X and Y coordinates for each pixel in the raster at the specified band.
Format: RS_PixelAsPoints(raster: Raster, band: Integer)
Since: v1.5.1
SQL Example
SELECT ST_AsText(RS_PixelAsPoints(raster, 1)) from rasters
Output:
[[POINT (-13065223 4021262.75),148.0,0,0], [POINT (-13065150 4021262.75),123.0,0,1], [POINT (-13065078 4021262.75),99.0,1,0], [POINT (-13065006 4021262.75),140.0,1,1]]
Spark SQL example for extracting Point, value, raster x and y coordinates:
val pointDf = sedona.read...
val rasterDf = sedona.read.format("binaryFile").load("/some/path/*.tiff")
var df = sedona.read.format("binaryFile").load("/some/path/*.tiff")
df = df.selectExpr("RS_FromGeoTiff(content) as raster")

df.selectExpr(
  "explode(RS_PixelAsPoints(raster, 1)) as exploded"
).selectExpr(
  "exploded.geom as geom",
  "exploded.value as value",
  "exploded.x as x",
  "exploded.y as y"
).show(3)
Output:
+--------------------------------------+-----+---+---+
|geom                                  |value|x  |y  |
+--------------------------------------+-----+---+---+
|POINT (-13095818 4021262.75)          |0.0  |1  |1  |
|POINT (-13095745.67138728 4021262.75) |0.0  |2  |1  |
|POINT (-13095673.342774557 4021262.75)|0.0  |3  |1  |
+--------------------------------------+-----+---+---+
RS_PixelAsPolygon
Introduction: Returns a polygon geometry that bounds the specified pixel.
The pixel coordinates specified are 1-indexed.
If colX and rowY are out of bounds for the raster, they are interpolated assuming the same skew and translate values.
Format: RS_PixelAsPolygon(raster: Raster, colX: Integer, rowY: Integer)
Since: v1.5.0
SQL Example
SELECT ST_AsText(RS_PixelAsPolygon(RS_MakeEmptyRaster(1, 5, 10, 123, -230, 8), 2, 3))
Output:
POLYGON ((131 -246, 139 -246, 139 -254, 131 -254, 131 -246))
RS_PixelAsPolygons
Introduction: Returns a list of the polygon geometry, the pixel value and its raster X and Y coordinates for each pixel in the raster at the specified band.
Format: RS_PixelAsPolygons(raster: Raster, band: Integer)
Since: v1.5.1
SQL Example
SELECT ST_AsText(RS_PixelAsPolygons(raster, 1)) from rasters
Output:
[[POLYGON ((123.19000244140625 -12, 127.19000244140625 -12, 127.19000244140625 -16, 123.19000244140625 -16, 123.19000244140625 -12)),0.0,1,1],
[POLYGON ((127.19000244140625 -12, 131.19000244140625 -12, 131.19000244140625 -16, 127.19000244140625 -16, 127.19000244140625 -12)),0.0,2,1],
[POLYGON ((131.19000244140625 -12, 135.19000244140625 -12, 135.19000244140625 -16, 131.19000244140625 -16, 131.19000244140625 -12)),0.0,3,1]]
Spark SQL example for extracting Point, value, raster x and y coordinates:
val pointDf = sedona.read...
val rasterDf = sedona.read.format("binaryFile").load("/some/path/*.tiff")
var df = sedona.read.format("binaryFile").load("/some/path/*.tiff")
df = df.selectExpr("RS_FromGeoTiff(content) as raster")

df.selectExpr(
  "explode(RS_PixelAsPolygons(raster, 1)) as exploded"
).selectExpr(
  "exploded.geom as geom",
  "exploded.value as value",
  "exploded.x as x",
  "exploded.y as y"
).show(3)
Output:
+--------------------+-----+---+---+
|                geom|value|  x|  y|
+--------------------+-----+---+---+
|POLYGON ((-130958...|  0.0|  1|  1|
|POLYGON ((-130957...|  0.0|  2|  1|
|POLYGON ((-130956...|  0.0|  3|  1|
+--------------------+-----+---+---+
Geometry Functions
RS_Envelope
Introduction: Returns the envelope of the raster as a Geometry.
Format: RS_Envelope (raster: Raster)
Since: v1.4.0
SQL Example
SELECT RS_Envelope(raster) FROM raster_table
Output:
POLYGON ((0 0,20 0,20 60,0 60,0 0))
RS_ConvexHull
Introduction: Return the convex hull geometry of the raster including the NoDataBandValue band pixels. For regular shaped and non-skewed rasters, this gives more or less the same result as RS_Envelope and hence is only useful for irregularly shaped or skewed rasters.
Format: RS_ConvexHull(raster: Raster)
Since: v1.5.0
SQL Example
SELECT RS_ConvexHull(RS_MakeEmptyRaster(1, 5, 10, 156, -132, 5, 10, 3, 5, 0));
Output:
POLYGON ((156 -132, 181 -107, 211 -7, 186 -32, 156 -132))
RS_MinConvexHull
Introduction: Returns the min convex hull geometry of the raster excluding the NoDataBandValue band pixels, in the given band. If no band is specified, all the bands are considered when creating the min convex hull of the raster. The created geometry representing the min convex hull has world coordinates of the raster in its CRS as the corner coordinates.
Note
If the specified band does not exist in the raster, RS_MinConvexHull throws an IllegalArgumentException
Format:
RS_MinConvexHull(raster: Raster)
RS_MinConvexHull(raster: Raster, band: Integer)
Since: v1.5.0
SQL Example
val inputDf = Seq((Seq(0, 0, 0, 0, 0, 0, 0, 0, 1, 0, 0, 1, 0, 0, 0, 0, 0, 0, 0, 0, 1, 0, 0, 0, 0),
        Seq(0, 0, 0, 0, 0, 0, 1, 0, 1, 0, 0, 0, 0, 0, 0, 0, 0, 0, 0, 0, 0, 0, 1, 1, 0))).toDF("values2", "values1")
inputDf.selectExpr("ST_AsText(RS_MinConvexHull(RS_AddBandFromArray(" +
        "RS_AddBandFromArray(RS_MakeEmptyRaster(2, 5, 5, 0, 0, 1, -1, 0, 0, 0), values1, 1, 0), values2, 2, 0))) as minConvexHullAll").show()
Output:
+----------------------------------------+
|minConvexHullAll                        |
+----------------------------------------+
|POLYGON ((0 -1, 4 -1, 4 -5, 0 -5, 0 -1))|
+----------------------------------------+
SQL Example
val inputDf = Seq((Seq(0, 0, 0, 0, 0, 0, 0, 0, 1, 0, 0, 1, 0, 0, 0, 0, 0, 0, 0, 0, 1, 0, 0, 0, 0),
        Seq(0, 0, 0, 0, 0, 0, 1, 0, 1, 0, 0, 0, 0, 0, 0, 0, 0, 0, 0, 0, 0, 0, 1, 1, 0))).toDF("values2", "values1")
inputDf.selectExpr("ST_AsText(RS_MinConvexHull(RS_AddBandFromArray(" +
  "RS_AddBandFromArray(RS_MakeEmptyRaster(2, 5, 5, 0, 0, 1, -1, 0, 0, 0), values1, 1, 0), values2, 2, 0), 1)) as minConvexHull1").show()
Output:
+----------------------------------------+
|minConvexHull1                          |
+----------------------------------------+
|POLYGON ((1 -1, 4 -1, 4 -5, 1 -5, 1 -1))|
+----------------------------------------+
SQL Example
SELECT RS_MinConvexHull(raster, 3) from rasters;
Output:
Provided band index 3 does not lie in the raster
Raster Accessors
RS_GeoReference
Introduction: Returns the georeference metadata of raster as a string in GDAL or ESRI format. Default is GDAL if not specified.
For more information about ScaleX, ScaleY, SkewX, SkewY, please refer to the Affine Transformations section.
Note
If you are using show() to display the output, it will show special characters as escape sequences. To get the expected behavior use the following code:
println(df.selectExpr("RS_GeoReference(rast)").sample(0.5).collect().mkString("\n"))
System.out.println(String.join("\n", df.selectExpr("RS_GeoReference(rast)").sample(0.5).collect()))
print("\n".join(df.selectExpr("RS_GeoReference(rast)").sample(0.5).collect()))
The sample() function is only there to reduce the data sent to collect(), you may also use filter() if that's appropriate.
Format: RS_GeoReference(raster: Raster, format: String = "GDAL")
Since: v1.5.0
Difference between format representation is as follows:
GDAL
ScaleX
SkewY
SkewX
ScaleY
UpperLeftX
UpperLeftY
ESRI
ScaleX
SkewY
SkewX
ScaleY
UpperLeftX + ScaleX * 0.5
UpperLeftY + ScaleY * 0.5
SQL Example
SELECT RS_GeoReference(ST_MakeEmptyRaster(1, 100, 100, -53, 51, 2, -2, 4, 5, 4326))
Output:
2.000000
5.000000
4.000000
-2.000000
-53.000000
51.000000
SQL Example
SELECT RS_GeoReference(ST_MakeEmptyRaster(1, 3, 4, 100.0, 200.0,2.0, -3.0, 0.1, 0.2, 0), "GDAL")
Output:
2.000000
0.200000
0.100000
-3.000000
100.000000
200.000000
SQL Example
SELECT RS_GeoReference(ST_MakeEmptyRaster(1, 3, 4, 100.0, 200.0,2.0, -3.0, 0.1, 0.2, 0), "ERSI")
2.000000
0.200000
0.100000
-3.000000
101.000000
198.500000
RS_GeoTransform
Introduction: Returns a struct of parameters that represent the GeoTransformation of the raster. The struct has the following schema:
- magnitudeI: size of a pixel along the transformed i axis
- magnitudeJ: size of a pixel along the transformed j axis
- thetaI: angle by which the raster is rotated (Radians positive clockwise)
- thetaIJ: angle from transformed i axis to transformed j axis (Radians positive counter-clockwise)
- offsetX: X ordinate of the upper-left corner of the upper-left pixel
- offsetY: Y ordinate of the upper-left corner of the upper-left pixel
Note
Refer to this image for a clear understanding between i & j axis and x & y-axis.
Format: RS_GeoTransform(raster: Raster)
Since: v1.5.1
SQL Example
SELECT RS_GeoTransform(
        RS_MakeEmptyRaster(2, 10, 15, 1, 2, 1, -2, 1, 2, 0)
       )
Output:
{2.23606797749979, 2.23606797749979, -1.1071487177940904, -2.214297435588181, 1.0, 2.0}
RS_Height
Introduction: Returns the height of the raster.
Format: RS_Height(raster: Raster)
Since: v1.5.0
SQL Example
SELECT RS_Height(raster) FROM rasters
Output:
512
RS_RasterToWorldCoordX
Introduction: Returns the upper left X coordinate of the given row and column of the given raster geometric units of the geo-referenced raster. If any out of bounds values are given, the X coordinate of the assumed point considering existing raster pixel size and skew values will be returned.
Format: RS_RasterToWorldCoordX(raster: Raster, colX: Integer, rowY: Integer)
Since: v1.5.0
SQL Example
SELECT RS_RasterToWorldCoordX(ST_MakeEmptyRaster(1, 5, 10, -123, 54, 5, -10, 0, 0, 4326), 1, 1) from rasters
Output:
-123
RS_RasterToWorldCoordY
Introduction: Returns the upper left Y coordinate of the given row and column of the given raster geometric units of the geo-referenced raster. If any out of bounds values are given, the Y coordinate of the assumed point considering existing raster pixel size and skew values will be returned.
Format: RS_RasterToWorldCoordY(raster: Raster, colX: Integer, rowY: Integer)
Since: v1.5.0
SQL Example
SELECT RS_RasterToWorldCoordY(ST_MakeEmptyRaster(1, 5, 10, -123, 54, 5, -10, 0, 0, 4326), 1, 1) from rasters
Output:
54
RS_RasterToWorldCoord
Introduction: Returns the upper left X and Y coordinates of the given row and column of the given raster geometric units of the geo-referenced raster as a Point geometry. If any out of bounds values are given, the X and Y coordinates of the assumed point considering existing raster pixel size and skew values will be returned.
Format: RS_RasterToWorldCoord(raster: Raster, colX: Integer, rowY: Integer)
Since: v1.5.1
SQL Example
SELECT RS_RasterToWorldCoord(ST_MakeEmptyRaster(1, 5, 10, -123, 54, 5, -10, 0, 0, 4326), 1, 1) from rasters
Output:
POINT (-123 54)
RS_Rotation
Introduction: Returns the uniform rotation of the raster in radian.
Format: RS_Rotation(raster: Raster)
Since: v1.5.1
SQL Example
SELECT RS_Rotation(
        RS_MakeEmptyRaster(2, 10, 15, 1, 2, 1, -2, 1, 2, 0)
        )
Output:
-1.1071487177940904
RS_ScaleX
Introduction: Returns the pixel width of the raster in CRS units.
Note
RS_ScaleX attempts to get an Affine transform on the grid in order to return scaleX (See World File for more details). If the transform on the geometry is not an Affine transform, RS_ScaleX will throw an UnsupportedException:
UnsupportedOperationException("Only AffineTransform2D is supported")
For more information about ScaleX, ScaleY, SkewX, SkewY, please refer to the Affine Transformations section.
Format: RS_ScaleX(raster: Raster)
Since: v1.5.0
SQL Example
SELECT RS_ScaleX(raster) FROM rasters
Output:
1
RS_ScaleY
Introduction: Returns the pixel height of the raster in CRS units.
Note
RS_ScaleY attempts to get an Affine transform on the grid in order to return scaleX (See World File for more details). If the transform on the geometry is not an Affine transform, RS_ScaleY will throw an UnsupportedException:
UnsupportedOperationException("Only AffineTransform2D is supported")
For more information about ScaleX, ScaleY, SkewX, SkewY, please refer to the Affine Transformations section.
Format: RS_ScaleY(raster: Raster)
Since: v1.5.0
SQL Example
SELECT RS_ScaleY(raster) FROM rasters
Output:
-2
RS_SkewX
Introduction: Returns the X skew or rotation parameter.
Format: RS_SkewX(raster: Raster)
Since: v1.5.0
SQL Example
SELECT RS_SkewX(RS_MakeEmptyRaster(2, 10, 10, 0.0, 0.0, 1.0, -1.0, 0.1, 0.2, 4326))
Output:
0.1
RS_SkewY
Introduction: Returns the Y skew or rotation parameter.
Format: RS_SkewY(raster: Raster)
Since: v1.5.0
SQL Example
SELECT RS_SkewY(RS_MakeEmptyRaster(2, 10, 10, 0.0, 0.0, 1.0, -1.0, 0.1, 0.2, 4326))
Output:
0.2
RS_UpperLeftX
Introduction: Returns the X coordinate of the upper-left corner of the raster.
Format: RS_UpperLeftX(raster: Raster)
Since: v1.5.0
SQL Example
SELECT RS_UpperLeftX(raster) FROM rasters
Output:
5
RS_UpperLeftY
Introduction: Returns the Y coordinate of the upper-left corner of the raster.
Format: RS_UpperLeftY(raster: Raster)
Since: v1.5.0
SQL Example
SELECT RS_UpperLeftY(raster) FROM rasters
Output:
6
RS_Width
Introduction: Returns the width of the raster.
Format: RS_Width(raster: Raster)
Since: v1.5.0
SQL Example
SELECT RS_Width(raster) FROM rasters
Output:
517
RS_WorldToRasterCoord
Introduction: Returns the grid coordinate of the given world coordinates as a Point.
Format:
RS_WorldToRasterCoord(raster: Raster, point: Geometry)
RS_WorldToRasterCoord(raster: Raster, x: Double, y: Point)
Since: v1.5.0
SQL Example
SELECT RS_WorldToRasterCoord(ST_MakeEmptyRaster(1, 5, 5, -53, 51, 1, -1, 0, 0, 4326), -53, 51) from rasters;
Output:
POINT (1 1)
SQL Example
SELECT RS_WorldToRasterCoord(ST_MakeEmptyRaster(1, 5, 5, -53, 51, 1, -1, 0, 0, 4326), ST_GeomFromText('POINT (-52 51)')) from rasters;
Output:
POINT (2 1)
Note
If the given geometry point is not in the same CRS as the given raster, the given geometry will be transformed to the given raster's CRS. You can use ST_Transform to transform the geometry beforehand.
RS_WorldToRasterCoordX
Introduction: Returns the X coordinate of the grid coordinate of the given world coordinates as an integer.
Format:
RS_WorldToRasterCoord(raster: Raster, point: Geometry)
RS_WorldToRasterCoord(raster: Raster, x: Double, y: Double)
Since: v1.5.0
SQL Example
SELECT RS_WorldToRasterCoordX(ST_MakeEmptyRaster(1, 5, 5, -53, 51, 1, -1, 0, 0), -53, 51) from rasters;
Output:
1
SQL Example
SELECT RS_WorldToRasterCoordX(ST_MakeEmptyRaster(1, 5, 5, -53, 51, 1, -1, 0, 0), ST_GeomFromText('POINT (-53 51)')) from rasters;
Output:
1
Tip
For non-skewed rasters, you can provide any value for latitude and the intended value of world longitude, to get the desired answer
RS_WorldToRasterCoordY
Introduction: Returns the Y coordinate of the grid coordinate of the given world coordinates as an integer.
Format:
RS_WorldToRasterCoordY(raster: Raster, point: Geometry)
RS_WorldToRasterCoordY(raster: Raster, x: Double, y: Double)
Since: v1.5.0
SQL Example
SELECT RS_WorldToRasterCoordY(ST_MakeEmptyRaster(1, 5, 5, -53, 51, 1, -1, 0, 0), ST_GeomFromText('POINT (-50 50)'));
Output:
2
SQL Example
SELECT RS_WorldToRasterCoordY(ST_MakeEmptyRaster(1, 5, 5, -53, 51, 1, -1, 0, 0), -50, 49);
Output:
3
Tip
For non-skewed rasters, you can provide any value for longitude and the intended value of world latitude, to get the desired answer
Raster Band Accessors
RS_Band
Introduction: Returns a new raster consisting 1 or more bands of an existing raster. It can build new rasters from existing ones, export only selected bands from a multiband raster, or rearrange the order of bands in a raster dataset.
Format:
RS_Band(raster: Raster, bands: ARRAY[Integer])
Since: v1.5.0
SQL Example
SELECT RS_NumBands(
        RS_Band(
            RS_AddBandFromArray(
                RS_MakeEmptyRaster(2, 5, 5, 3, -215, 2, -2, 2, 2, 0),
                Array(16, 0, 24, 33, 43, 49, 64, 0, 76, 77, 79, 89, 0, 116, 118, 125, 135, 0, 157, 190, 215, 229, 241, 248, 249),
                1, 0d
            ), Array(1,1,1)
        )
    )
Output:
3
RS_BandNoDataValue
Introduction: Returns the no data value of the given band of the given raster. If no band is given, band 1 is assumed. The band parameter is 1-indexed. If there is no data value associated with the given band, RS_BandNoDataValue returns null.
Note
If the given band does not lie in the raster, RS_BandNoDataValue throws an IllegalArgumentException
Format: RS_BandNoDataValue (raster: Raster, band: Integer = 1)
Since: v1.5.0
SQL Example
SELECT RS_BandNoDataValue(raster, 1) from rasters;
Output:
0.0
SQL Example
SELECT RS_BandNoDataValue(raster) from rasters_without_nodata;
Output:
null
SQL Example
SELECT RS_BandNoDataValue(raster, 3) from rasters;
Output:
IllegalArgumentException: Provided band index 3 is not present in the raster.
RS_BandIsNoData
Returns true if the band is filled with only nodata values. Band 1 is assumed if not specified.
Format: RS_BandIsNoData(raster: Raster, band: Integer = 1)
Since: v1.5.0
SQL Example
WITH rast_table AS (SELECT RS_AddBandFromArray(RS_MakeEmptyRaster(1, 2, 2, 0, 0, 1), ARRAY(10d, 10d, 10d, 10d), 1, 10d) as rast)
SELECT RS_BandIsNoData(rast) from rast_table
Output:
true
RS_BandPixelType
Introduction: Returns the datatype of each pixel in the given band of the given raster in string format. The band parameter is 1-indexed. If no band is specified, band 1 is assumed.
Note
If the given band index does not exist in the given raster, RS_BandPixelType throws an IllegalArgumentException.
Following are the possible values returned by RS_BandPixelType:
REAL_64BITS- For Double valuesREAL_32BITS- For Float valuesSIGNED_32BITS- For Integer valuesSIGNED_16BITS- For Short valuesUNSIGNED_16BITS- For unsigned Short valuesUNSIGNED_8BITS- For Byte values
Format: RS_BandPixelType(rast: Raster, band: Integer = 1)
Since: v1.5.0
SQL Example
SELECT RS_BandPixelType(RS_MakeEmptyRaster(2, "D", 5, 5, 53, 51, 1, 1, 0, 0, 0), 2);
Output:
REAL_64BITS
SELECT RS_BandPixelType(RS_MakeEmptyRaster(2, "I", 5, 5, 53, 51, 1, 1, 0, 0, 0));
Output:
SIGNED_32BITS
SELECT RS_BandPixelType(RS_MakeEmptyRaster(2, "I", 5, 5, 53, 51, 1, 1, 0, 0, 0), 3);
Output:
IllegalArgumentException: Provided band index 3 is not present in the raster
RS_Count
Introduction: Returns the number of pixels in a given band. If band is not specified then it defaults to 1.
Note
If excludeNoDataValue is set true then it will only count pixels with value not equal to the nodata value of the raster.
Set excludeNoDataValue to false to get count of all pixels in raster.
Note
If the mentioned band index doesn't exist, this will throw an IllegalArgumentException.
Format:
RS_Count(raster: Raster, band: Integer = 1, excludeNoDataValue: Boolean = true)
RS_Count(raster: Raster, band: Integer = 1)
RS_Count(raster: Raster)
Since: v1.5.0
SQL Example
SELECT RS_Count(RS_MakeEmptyRaster(2, 5, 5, 0, 0, 1, -1, 0, 0, 0), 1, false)
Output:
25
SQL Example
SELECT RS_Count(RS_MakeEmptyRaster(2, 5, 5, 0, 0, 1, -1, 0, 0, 0), 1)
Output:
6
RS_SummaryStats
Introduction: Returns summary statistic for a particular band based on the statType parameter. The function defaults to band index of 1 when band is not specified and excludes noDataValue if excludeNoDataValue is not specified.
statType parameter takes the following strings:
count: Total count of all pixels in the specified bandsum: Sum of all pixel values in the specified bandmean: Mean value of all pixel values in the specified bandstddev: Standard deviation of all pixels in the specified bandmin: Minimum pixel value in the specified bandmax: Maximum pixel value in the specified band
Note
If excludeNoDataValue is set true then it will only count pixels with value not equal to the nodata value of the raster.
Set excludeNoDataValue to false to get count of all pixels in raster.
Formats:
RS_SummaryStats(raster: Raster, statType: String, band: Integer = 1, excludeNoDataValue: Boolean = true)
RS_SummaryStats(raster: Raster, statType: String, band: Integer = 1)
RS_SummaryStats(raster: Raster, statType: String)
Since: v1.6.0
SQL Example
SELECT RS_SummaryStats(RS_MakeEmptyRaster(2, 5, 5, 0, 0, 1, -1, 0, 0, 0), "stddev", 1, false)
Output:
9.4678403028357
RS_SummaryStatsAll
Introduction: Returns summary stats struct consisting of count, sum, mean, stddev, min, max for a given band in raster. If band is not specified then it defaults to 1.
Note
If excludeNoDataValue is set true then it will only count pixels with value not equal to the nodata value of the raster.
Set excludeNoDataValue to false to get count of all pixels in raster.
Note
If the mentioned band index doesn't exist, this will throw an IllegalArgumentException.
Formats:
RS_SummaryStatsAll(raster: Raster, band: Integer = 1, excludeNoDataValue: Boolean = true)
RS_SummaryStatsAll(raster: Raster, band: Integer = 1)
RS_SummaryStatsAll(raster: Raster)
Since: v1.5.0
SQL Example
SELECT RS_SummaryStatsAll(RS_MakeEmptyRaster(2, 5, 5, 0, 0, 1, -1, 0, 0, 0), 1, false)
Output:
{25.0, 204.0, 8.16, 9.4678403028357, 0.0, 25.0}
SQL Example
SELECT RS_SummaryStatsAll(RS_MakeEmptyRaster(2, 5, 5, 0, 0, 1, -1, 0, 0, 0), 1)
Output:
{14.0, 204.0, 14.571428571428571, 11.509091348732502, 1.0, 25.0}
RS_ZonalStats
Introduction: This returns a statistic value specified by statType over the region of interest defined by zone. It computes the statistic from the pixel values within the ROI geometry and returns the result. If the excludeNoData parameter is not specified, it will default to true. This excludes NoData values from the statistic calculation. Additionally, if the band parameter is not provided, band 1 will be used by default for the statistic computation. The valid options for statType are:
The allTouched parameter (Since v1.7.1) determines how pixels are selected:
- When true, any pixel touched by the geometry will be included.
-
When false (default), only pixels whose centroid intersects with the geometry will be included.
-
count: Number of pixels in the region. sum: Sum of pixel values.mean|average|avg: Arithmetic mean.median: Middle value in the region.mode: Most occurring value, if there are multiple values with same occurrence then will return the largest number.stddev|sd: Standard deviation.variance: Variance.min: Minimum value in the region.max: Maximum value in the region.
Note
If the coordinate reference system (CRS) of the input zone geometry differs from that of the raster, then zone will be transformed to match the CRS of the raster before computation.
The following conditions will throw an IllegalArgumentException if they are not met:
- The provided
rasterandzonegeometry should intersect whenlenientparameter is set tofalse. - The option provided to
statTypeshould be valid.
lenient parameter is set to true by default. The function will return null if the raster and zone geometry do not intersect.
Format:
RS_ZonalStats(raster: Raster, zone: Geometry, band: Integer, statType: String, allTouched: Boolean, excludeNoData: Boolean, lenient: Boolean)
RS_ZonalStats(raster: Raster, zone: Geometry, band: Integer, statType: String, allTouched: Boolean, excludeNoData: Boolean)
RS_ZonalStats(raster: Raster, zone: Geometry, band: Integer, statType: String, allTouched: Boolean)
RS_ZonalStats(raster: Raster, zone: Geometry, statType: String, allTouched: Boolean)
RS_ZonalStats(raster: Raster, zone: Geometry, statType: String)
Since: v1.5.1
SQL Example
RS_ZonalStats(rast1, geom1, 1, 'sum', true, false)
Output:
10690406
SQL Example
RS_ZonalStats(rast2, geom2, 1, 'mean', false, true)
Output:
226.55992667794473
RS_ZonalStatsAll
Introduction: Returns a struct of statistic values, where each statistic is computed over a region defined by the zone geometry. The struct has the following schema:
The allTouched parameter (Since v1.7.1) determines how pixels are selected:
- When true, any pixel touched by the geometry will be included.
-
When false (default), only pixels whose centroid intersects with the geometry will be included.
-
count: Count of the pixels.
- sum: Sum of the pixel values.
- mean: Arithmetic mean.
- median: Median.
- mode: Mode.
- stddev: Standard deviation.
- variance: Variance.
- min: Minimum value of the zone.
- max: Maximum value of the zone.
Note
If the coordinate reference system (CRS) of the input zone geometry differs from that of the raster, then zone will be transformed to match the CRS of the raster before computation.
The following conditions will throw an IllegalArgumentException if they are not met:
- The provided
rasterandzonegeometry should intersect whenlenientparameter is set tofalse. - The option provided to
statTypeshould be valid.
lenient parameter is set to true by default. The function will return null if the raster and zone geometry do not intersect.
Format:
RS_ZonalStatsAll(raster: Raster, zone: Geometry, band: Integer, allTouched: Boolean, excludeNodata: Boolean, lenient: Boolean)
RS_ZonalStatsAll(raster: Raster, zone: Geometry, band: Integer, allTouched: Boolean, excludeNodata: Boolean)
RS_ZonalStatsAll(raster: Raster, zone: Geometry, band: Integer, allTouched: Boolean)
RS_ZonalStatsAll(raster: Raster, zone: Geometry, band: Integer)
RS_ZonalStatsAll(raster: Raster, zone: Geometry)
Since: v1.5.1
SQL Example
RS_ZonalStatsAll(rast1, geom1, 1, true, false)
Output:
{184792.0, 1.0690406E7, 57.851021689230684, 0.0, 0.0, 92.13277429243035, 8488.448098819916, 0.0, 255.0}
SQL Example
RS_ZonalStatsAll(rast2, geom2, 1, false, true)
Output:
{14184.0, 3213526.0, 226.55992667794473, 255.0, 255.0, 74.87605357255357, 5606.423398599913, 1.0, 255.0}
Raster Predicates
RS_Contains
Introduction: Returns true if the geometry or raster on the left side contains the geometry or raster on the right side. The convex hull of the raster is considered in the test.
The rules for testing spatial relationship is the same as RS_Intersects.
Format:
RS_Contains(raster: Raster, geom: Geometry)
RS_Contains(geom: Geometry, raster: Raster)
RS_Contains(raster0: Raster, raster1: Raster)
Since: v1.5.0
SQL Example
SELECT RS_Contains(RS_MakeEmptyRaster(1, 20, 20, 2, 22, 1), ST_GeomFromWKT('POLYGON ((5 5, 5 10, 10 10, 10 5, 5 5))')) rast_geom,
    RS_Contains(RS_MakeEmptyRaster(1, 20, 20, 2, 22, 1), RS_MakeEmptyRaster(1, 10, 10, 2, 22, 1)) rast_rast
Output:
+---------+---------+
|rast_geom|rast_rast|
+---------+---------+
|     true|     true|
+---------+---------+
RS_Intersects
Introduction: Returns true if raster or geometry on the left side intersects with the raster or geometry on the right side. The convex hull of the raster is considered in the test.
Rules for testing spatial relationship:
- If the raster or geometry does not have a defined SRID, it is assumed to be in WGS84.
- If both sides are in the same CRS, then perform the relationship test directly.
- Otherwise, both sides will be transformed to WGS84 before the relationship test.
Format:
RS_Intersects(raster: Raster, geom: Geometry)
RS_Intersects(geom: Geometry, raster: Raster)
RS_Intersects(raster0: Raster, raster1: Raster)
Since: v1.5.0
SQL Example
SELECT RS_Intersects(RS_MakeEmptyRaster(1, 20, 20, 2, 22, 1), ST_SetSRID(ST_PolygonFromEnvelope(0, 0, 10, 10), 4326)) rast_geom,
    RS_Intersects(RS_MakeEmptyRaster(1, 20, 20, 2, 22, 1), RS_MakeEmptyRaster(1, 10, 10, 1, 11, 1)) rast_rast
Output:
+---------+---------+
|rast_geom|rast_rast|
+---------+---------+
|     true|     true|
+---------+---------+
RS_Within
Introduction: Returns true if the geometry or raster on the left side is within the geometry or raster on the right side. The convex hull of the raster is considered in the test.
The rules for testing spatial relationship is the same as RS_Intersects.
Format: RS_Within(raster: Raster, geom: Geometry)
Format: RS_Within(geom: Geometry, raster: Raster)
Format: RS_Within(raster0: Raster, raster1: Raster)
Since: v1.5.0
SQL Example
SELECT RS_Within(RS_MakeEmptyRaster(1, 20, 20, 2, 22, 1), ST_GeomFromWKT('POLYGON ((0 0, 0 50, 100 50, 100 0, 0 0))')) rast_geom,
    RS_Within(RS_MakeEmptyRaster(1, 20, 20, 2, 22, 1), RS_MakeEmptyRaster(1, 30, 30, 2, 22, 1)) rast_rast
Output:
+---------+---------+
|rast_geom|rast_rast|
+---------+---------+
|     true|     true|
+---------+---------+
Raster Based Operators
RS_AddBand
Introduction: Adds a new band to a raster toRaster at a specified index toRasterIndex. The new band's values are copied from fromRaster at a specified band index fromBand.
If no toRasterIndex is provided, the new band is appended to the end of toRaster. If no fromBand is specified, band 1 from fromRaster is copied by default.
Note
IllegalArgumentException will be thrown in these cases:
- The provided Rasters,
toRaster&fromRasterdon't have same shape. - The provided
fromBandis not infromRaster. - The provided
toRasterIndexis not in or at end oftoRaster.
Format:
RS_AddBand(toRaster: Raster, fromRaster: Raster, fromBand: Integer = 1, toRasterIndex: Integer = at_end)
RS_AddBand(toRaster: Raster, fromRaster: Raster, fromBand: Integer = 1)
RS_AddBand(toRaster: Raster, fromRaster: Raster)
Since: v1.5.0
SQL Example
SELECT RS_AddBand(raster1, raster2, 2, 1) FROM rasters
Output:
GridCoverage2D["g...
RS_Clip
Introduction: Returns a raster that is clipped by the given geometry.
If crop is not specified then it will default to true, meaning it will make the resulting raster shrink to the geometry's extent and if noDataValue is not specified then the resulting raster will have the minimum possible value for the band pixel data type.
The allTouched parameter (Since v1.7.1) determines how pixels are selected:
- When true, any pixel touched by the geometry will be included.
- When false (default), only pixels whose centroid intersects with the geometry will be included.
Note
- Since
v1.5.1, if the coordinate reference system (CRS) of the inputgeomgeometry differs from that of theraster, thengeomwill be transformed to match the CRS of theraster. If therasterorgeomdoesn't have a CRS then it will default to4326/WGS84. - Since
v1.7.0,RS_Clipfunction will returnnullif therasterandgeometrygeometry do not intersect. If you want to throw an exception in this case, you can set thelenientparameter tofalse.
Format:
RS_Clip(raster: Raster, band: Integer, geom: Geometry, allTouched: Boolean, noDataValue: Double, crop: Boolean, lenient: Boolean)
RS_Clip(raster: Raster, band: Integer, geom: Geometry, allTouched: Boolean, noDataValue: Double, crop: Boolean)
RS_Clip(raster: Raster, band: Integer, geom: Geometry, allTouched: Boolean, noDataValue: Double)
RS_Clip(raster: Raster, band: Integer, geom: Geometry, allTouched: Boolean)
RS_Clip(raster: Raster, band: Integer, geom: Geometry)
Since: v1.5.1
Original Raster:

SQL Example
SELECT RS_Clip(
        RS_FromGeoTiff(content), 1,
        ST_GeomFromWKT('POLYGON ((236722 4204770, 243900 4204770, 243900 4197590, 221170 4197590, 236722 4204770))'),
        false, 200, true
    )
Output:

SQL Example
SELECT RS_Clip(
        RS_FromGeoTiff(content), 1,
        ST_GeomFromWKT('POLYGON ((236722 4204770, 243900 4204770, 243900 4197590, 221170 4197590, 236722 4204770))'),
        false, 200, false
    )
Output:

RS_Interpolate
Introduction: This function performs interpolation on a raster using the Inverse Distance Weighted (IDW) method. This method estimates cell values by averaging the values of sample data points in the vicinity of each processing cell. The influence of a sample point on the interpolated value is inversely proportional to the distance from the cell being estimated, with nearer points having more influence or weight in the averaging process.
This technique is effective in scenarios where continuity of spatial data is important, and it is essential to estimate values for locations that do not have direct measurements, often represented by NaN or noDataValue in raster data.
Note
This method assumes that the spatial influence of a variable diminishes with distance. In geospatial analysis, this means features or phenomena closer to a point of interest are given more weight than those further away. For example, in environmental data analysis, measurements from nearby locations have a greater impact on interpolated values than distant ones, reflecting the natural gradation and spatial continuity.
Formats:
RS_Interpolate(raster: Raster)
RS_Interpolate(raster: Raster, power: Double)
RS_Interpolate(raster: Raster, power: Double, mode: String)
RS_Interpolate(raster: Raster, power: Double, mode: String, numPointsOrRadius: Double)
RS_Interpolate(raster: Raster, power: Double, mode: String, numPointsOrRadius: Double, maxRadiusOrMinPoints: Double)
RS_Interpolate(raster: Raster, power: Double, mode: String, numPointsOrRadius: Double, maxRadiusOrMinPoints: Double, band: Integer)
Since: v1.6.0
Parameters:
raster: The raster to be interpolated.band: The band of the raster to be used for interpolation. Ifbandis not provided, interpolation is performed across all bands.power: A positive real number defining the exponent of distance in the IDW calculation. This parameter controls the influence of distant points on the interpolated values, default being set to 2.mode: Specifies the interpolation mode - either"Variable"or"Fixed".- In
"Variable"mode:numPointsOrRadius: Specifies the number of nearest input points to be used for interpolation. Defaults to 12 if not provided.maxRadiusOrMinPoints: Sets the maximum search radius, with the default being the diagonal length of the raster.
- In
"Fixed"mode:numPointsOrRadius: Defines the radius within which input sample points are considered. Defaults to the diagonal length of the raster if not specified.maxRadiusOrMinPoints: Represents the minimum number of points required within the radius. Defaults to 0 if not provided.
SQL Example:
SELECT RS_Interpolate(raster, 1, 2.0, 'Variable', 12, 1000)
Output (Shown as heatmap):


RS_MetaData
Introduction: Returns the metadata of the raster as a struct. The struct has the following schema:
- upperLeftX: upper left x coordinate of the raster, in terms of CRS units
- upperLeftX: upper left y coordinate of the raster, in terms of CRS units
- gridWidth: width of the raster, in terms of pixels
- gridHeight: height of the raster, in terms of pixels
- scaleX: ScaleX: the scaling factor in the x direction
- scaleY: ScaleY: the scaling factor in the y direction
- skewX: skew in x direction (rotation x)
- skewY: skew in y direction (rotation y)
- srid: srid of the raster
- numSampleDimensions: number of bands
- tileWidth: (Since
v1.6.1) width of tiles in the raster - tileHeight: (Since
v1.6.1) height of tiles in the raster
For more information about ScaleX, ScaleY, SkewX, SkewY, please refer to the Affine Transformations section.
tileWidth and tileHeight are available since v1.6.1, they are the dimensions of the tiles in the raster. For example,
rasters written by RS_FromGeoTiff uses the tiling scheme of the loaded GeoTIFF file. For rasters that has only 1 tile,
tileWidth and tileHeight will be equal to gridWidth and gridHeight respectively.
Format: RS_MetaData (raster: Raster)
Since: v1.4.1
SQL Example
SELECT RS_MetaData(raster) FROM raster_table
Output:
{-1.3095817809482181E7, 4021262.7487925636, 512, 517, 72.32861272132695, -72.32861272132695, 0.0, 0.0, 3857, 1, 256, 256}
RS_NormalizeAll
Introduction: Normalizes values in all bands of a raster between a given normalization range. The function maintains the data type of the raster values by ensuring that the normalized values are cast back to the original data type of each band in the raster. By default, the values are normalized to range [0, 255]. RS_NormalizeAll can take upto 7 of the following arguments.
raster: The raster to be normalized.minLimandmaxLim(Optional): The lower and upper limits of the normalization range. By default, normalization range is set to [0, 255].normalizeAcrossBands(Optional): A boolean flag to determine the normalization method. If set to true (default), normalization is performed across all bands based on global min and max values. If false, each band is normalized individually based on its own min and max values.noDataValue(Optional): Defines the value to be used for missing or invalid data in raster bands. By default, noDataValue is set tomaxLimand Safety mode is triggered.minValueandmaxValue(Optional): Optionally, specific minimum and maximum values of the input raster can be provided. If not provided, these values are computed from the raster data.
A Safety mode is triggered when noDataValue is not given. This sets noDataValue to maxLim and normalizes valid data values to the range [minLim, maxLim-1]. This is to avoid replacing valid data that might coincide with the new noDataValue.
Warning
Using a noDataValue that falls within the normalization range can lead to loss of valid data. If any data value within a raster band matches the specified noDataValue, it will be replaced and cannot be distinguished or recovered later. Exercise caution in selecting a noDataValue to avoid unintentional data alteration.
Formats:
RS_NormalizeAll (raster: Raster)
RS_NormalizeAll (raster: Raster, minLim: Double, maxLim: Double)
RS_NormalizeAll (raster: Raster, minLim: Double, maxLim: Double, normalizeAcrossBands: Boolean)
RS_NormalizeAll (raster: Raster, minLim: Double, maxLim: Double, normalizeAcrossBands: Boolean, noDataValue: Double)
RS_NormalizeAll (raster: Raster, minLim: Double, maxLim: Double, noDataValue: Double, minValue: Double, maxValue: Double)
RS_NormalizeAll (raster: Raster, minLim: Double, maxLim: Double, normalizeAcrossBands: Boolean, noDataValue: Double, minValue: Double, maxValue: Double )
Since: v1.6.0
SQL Example
SELECT RS_NormalizeAll(raster, 0, 1)
RS_NumBands
Introduction: Returns the number of the bands in the raster.
Format: RS_NumBands (raster: Raster)
Since: v1.4.0
SQL Example
SELECT RS_NumBands(raster) FROM raster_table
Output:
4
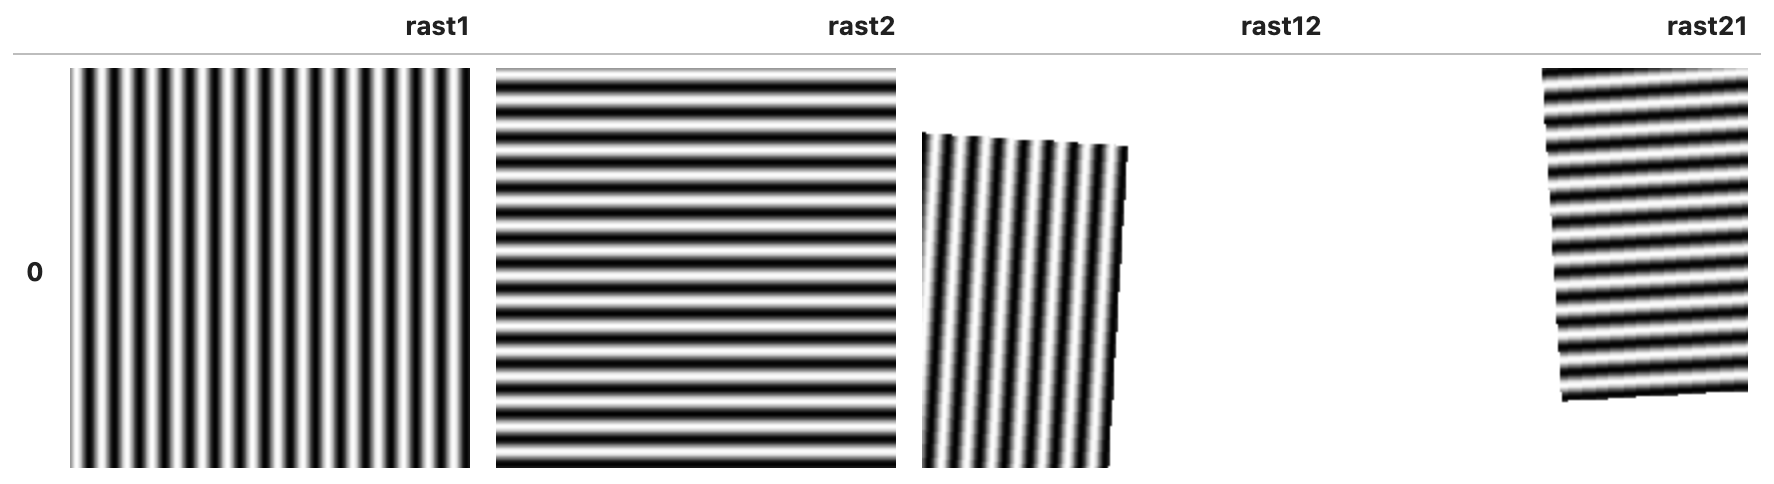
RS_ReprojectMatch
Introduction: Reproject a raster to match the geo-reference, CRS, and envelope of a reference raster. The output raster always have the same extent and resolution as the reference raster. For pixels not covered by the input raster, nodata value is assigned, or 0 is assigned if the input raster does not have nodata value.
The default resampling algorithm is NearestNeighbor. The following resampling algorithms are supported (case-insensitive):
- NearestNeighbor
- Bilinear
- Bicubic
This function serves the same purpose as the RasterArray.reproject_match function in rioxarray.
Format:
RS_ReprojectMatch (raster: Raster, reference: Raster, algorithm: String)
Since: v1.6.0
SQL Example
WITH t AS (
    SELECT RS_MapAlgebra(RS_MakeEmptyRaster(1, 500, 500, 308736,4091167, 1000, -1000, 0, 0, 32611), 'D', 'out = sin(x() * 0.2);') rast1,
        RS_MapAlgebra(RS_MakeEmptyRaster(1, 500, 500, 16536,4185970, 1000, -1000, 0, 0, 32612), 'D', 'out = sin(y() * 0.2);') rast2
) SELECT t.rast1, t.rast2, RS_ReprojectMatch(rast1, rast2) rast12, RS_ReprojectMatch(rast2, rast1) rast21 FROM t
Output:
RS_Resample
Introduction: Resamples a raster using a given resampling algorithm and new dimensions (width and height), a new grid corner to pivot the raster at (gridX and gridY) and a set of georeferencing attributes (scaleX and scaleY).
RS_Resample also provides an option to pass a reference raster to draw the georeferencing attributes out of. However, the SRIDs of the input and reference raster must be same, otherwise RS_Resample throws an IllegalArgumentException.
For the purpose of resampling, width-height pair and scaleX-scaleY pair are mutually exclusive, meaning any one of them can be used at a time.
The useScale parameter controls whether to use width-height or scaleX-scaleY. If useScale is false, the provided widthOrScale and heightOrScale values will be floored to integers and considered as width and height respectively (floating point width and height are not allowed). Otherwise, they are considered as scaleX and scaleY respectively.
Currently, RS_Resample does not support skewed rasters, and hence even if a skewed reference raster is provided, its skew values are ignored. If the input raster is skewed, the output raster geometry and interpolation may be incorrect.
The default algorithm used for resampling is NearestNeighbor, and hence if a null, empty or invalid value of algorithm is provided, RS_Resample defaults to using NearestNeighbor. However, the algorithm parameter is non-optional.
Following are valid values for the algorithm parameter (Case-insensitive):
- NearestNeighbor
- Bilinear
- Bicubic
Tip
If you just want to resize or rescale an input raster, you can use RS_Resample(raster: Raster, widthOrScale: Double, heightOrScale: Double, useScale: Boolean, algorithm: String)
For more information about ScaleX, ScaleY, SkewX, SkewY, please refer to the Affine Transformations section.
Format:
RS_Resample(raster: Raster, widthOrScale: Double, heightOrScale: Double, gridX: Double, gridY: Double, useScale: Boolean, algorithm: String)
RS_Resample(raster: Raster, widthOrScale: Double, heightOrScale: Double, useScale: Boolean, algorithm: String)
RS_Resample(raster: Raster, referenceRaster: Raster, useScale: Boolean, algorithm: String)
Since: v1.5.0
SQL Example
WITH INPUT_RASTER AS (
 SELECT RS_AddBandFromArray(
    RS_MakeEmptyRaster(1, 'd', 4, 3, 0, 0, 2, -2, 0, 0, 0),
    ARRAY(1, 2, 3, 5, 4, 5, 6, 9, 7, 8, 9, 10), 1, null) as rast
),
RESAMPLED_RASTER AS (
 SELECT RS_Resample(rast, 6, 5, 1, -1, false, null) as resample_rast from INPUT_RASTER
)
SELECT RS_AsMatrix(resample_rast) as rast_matrix, RS_Metadata(resample_rast) as rast_metadata from RESAMPLED_RASTER
Output:
| 1.0   1.0   2.0   3.0   3.0   5.0|
| 1.0   1.0   2.0   3.0   3.0   5.0|
| 4.0   4.0   5.0   6.0   6.0   9.0|
| 7.0   7.0   8.0   9.0   9.0  10.0|
| 7.0   7.0   8.0   9.0   9.0  10.0|

(-0.33333333333333326,0.19999999999999996,6,5,1.388888888888889,-1.24,0,0,0,1)
SQL Example
 WITH INPUT_RASTER AS (
   SELECT RS_AddBandFromArray(
    RS_MakeEmptyRaster(1, 'd', 4, 3, 0, 0, 2, -2, 0, 0, 0),
    ARRAY(1, 2, 3, 5, 4, 5, 6, 9, 7, 8, 9, 10), 1, null) as rast
   ),
   RESAMPLED_RASTER AS (
    SELECT RS_Resample(rast, 1.2, -1.4, true, null) as resample_rast from INPUT_RASTER
   )
SELECT RS_AsMatrix(resample_rast) as rast_matrix, RS_Metadata(resample_rast) as rast_metadata from RESAMPLED_RASTER
Output:
|       NaN         NaN         NaN         NaN         NaN         NaN         NaN|
|       NaN    3.050000    3.650000    4.250000    5.160000    6.690000    7.200000|
|       NaN    5.150000    5.750000    6.350000    7.250000    8.750000    9.250000|
|       NaN    7.250000    7.850000    8.450000    9.070000    9.730000    9.950000|
|       NaN    7.400000    8.000000    8.600000    9.200000    9.800000   10.000000|

(0.0, 0.0, 7.0, 5.0, 1.2, -1.4, 0.0, 0.0, 0.0, 1.0)
SQL Example
WITH INPUT_RASTER AS (
    SELECT RS_AddBandFromArray(RS_MakeEmptyRaster(1, 'd', 4, 3, 0, 0, 2, -2, 0, 0, 0), ARRAY(1, 2, 3, 5, 4, 5, 6, 9, 7, 8, 9, 10), 1, null) as rast
),
REF_RASTER AS (
    SELECT RS_MakeEmptyRaster(2, 'd', 6, 5, 1, -1, 1.2, -1.4, 0, 0, 0) as ref_rast
),
RESAMPLED_RASTER AS (
    SELECT RS_Resample(rast, ref_rast, true, null) as resample_rast from INPUT_RASTER, REF_RASTER
)
SELECT RS_AsMatrix(resample_rast) as rast_matrix, RS_Metadata(resample_rast) as rast_metadata from RESAMPLED_RASTER
Output:
| 1.0   1.0   2.0   3.0   3.0   5.0   5.0|
| 1.0   1.0   2.0   3.0   3.0   5.0   5.0|
| 4.0   4.0   5.0   6.0   6.0   9.0   9.0|
| 7.0   7.0   8.0   9.0   9.0  10.0  10.0|
| 7.0   7.0   8.0   9.0   9.0  10.0  10.0|

(-0.20000000298023224, 0.4000000059604645, 7.0, 5.0, 1.2, -1.4, 0.0, 0.0, 0.0, 1.0)
RS_SetBandNoDataValue
Introduction: This sets the no data value for a specified band in the raster. If the band index is not provided, band 1 is assumed by default. Passing a null value for noDataValue will remove the no data value and that will ensure all pixels are included in functions rather than excluded as no data.
Since v1.5.1, this function supports the ability to replace the current no-data value with the new noDataValue.
Note
When replace is true, any pixels matching the provided noDataValue will be considered as no-data in the output raster.
An IllegalArgumentException will be thrown if the input raster does not already have a no-data value defined. Replacing existing values with noDataValue requires a defined no-data baseline to evaluate against.
To use this for no-data replacement, the input raster must first set its no-data value, which can then be selectively replaced via this function.
Format:
RS_SetBandNoDataValue(raster: Raster, bandIndex: Integer, noDataValue: Double, replace: Boolean)
RS_SetBandNoDataValue(raster: Raster, bandIndex: Integer = 1, noDataValue: Double)
Since: v1.5.0
SQL Example
SELECT RS_BandNoDataValue(
        RS_SetBandNoDataValue(
            RS_MakeEmptyRaster(1, 20, 20, 2, 22, 2, 3, 1, 1, 0),
            -999
            )
        )
Output:
-999
RS_SetGeoReference
Introduction: Sets the Georeference information of an object in a single call. Accepts inputs in GDAL and ESRI format.
Default format is GDAL. If all 6 parameters are not provided then will return null.
For more information about ScaleX, ScaleY, SkewX, SkewY, please refer to the Affine Transformations section.
Format:
RS_SetGeoReference(raster: Raster, geoRefCoord: String, format: String = "GDAL")
RS_SetGeoReference(raster: Raster, upperLeftX: Double, upperLeftY: Double, scaleX: Double, scaleY: Double, skewX: Double, skewY: Double)
Since: v1.5.0
Difference between format representation is as follows:
GDAL
ScaleX SkewY SkewX ScaleY UpperLeftX UpperLeftY
ESRI
ScaleX SkewY SkewX ScaleY (UpperLeftX + ScaleX * 0.5) (UpperLeftY + ScaleY * 0.5)
SQL Example
SELECT RS_GeoReference(
        RS_SetGeoReference(
            RS_MakeEmptyRaster(1, 20, 20, 2, 22, 2, 3, 1, 1, 0),
            '3 1.5 1.5 2 22 3'
        )
    )
Output:
3.000000
1.500000
1.500000
2.000000
22.000000
3.000000
SQL Example
SELECT RS_GeoReference(
        RS_SetGeoReference(
            RS_MakeEmptyRaster(1, 20, 20, 2, 22, 2, 3, 1, 1, 0),
            '3 1.5 1.5 2 22 3', 'ESRI'
        )
    )
Output:
3.000000
1.500000
1.500000
2.000000
20.500000
2.000000
SQL Example
SELECT RS_GeoReference(
        RS_SetGeoReference(
            RS_MakeEmptyRaster(2, 5, 5, 0, 0, 1, -1, 0, 0, 0),
            8, -3, 4, 5, 0.2, 0.2
        )
    )
Output:
4.000000
0.200000
0.200000
5.000000
8.000000
-3.000000
RS_SetPixelType
Introduction: Returns a modified raster with the desired pixel data type.
The dataType parameter accepts one of the following strings.
- "D" - 64 bits Double
- "F" - 32 bits Float
- "I" - 32 bits signed Integer
- "S" - 16 bits signed Short
- "US" - 16 bits unsigned Short
- "B" - 8 bits unsigned Byte
Note
If the specified dataType is narrower than the original data type, the function will truncate the pixel values to fit the new data type range.
Format:
RS_SetPixelType(raster: Raster, dataType: String)
Since: v1.6.0
SQL Example:
RS_SetPixelType(raster, "I")
RS_SetValue
Introduction: Returns a raster by replacing the value of pixel specified by colX and rowY.
Format:
RS_SetValue(raster: Raster, bandIndex: Integer = 1, colX: Integer, rowY: Integer, newValue: Double)
Since: v1.5.0
SQL Example
SELECT RS_BandAsArray(
               RS_SetValue(
                       RS_AddBandFromArray(
                               RS_MakeEmptyRaster(1, 5, 5, 0, 0, 1, -1, 0, 0, 0),
                           [1,1,1,0,0,0,1,2,3,3,5,6,7,0,0,3,0,0,3,0,0,0,0,0,0], 1, 0d
                           ),
                       1, 2, 2, 255
                   )
           )
Output:
[1.0, 1.0, 1.0, 0.0, 0.0, 0.0, 255.0, 2.0, 3.0, 3.0, 5.0, 6.0, 7.0, 0.0, 0.0, 3.0, 0.0, 0.0, 3.0, 0.0, 0.0, 0.0, 0.0, 0.0, 0.0]
RS_SetValues
Introduction: Returns a raster by replacing the values of pixels in a specified rectangular region. The top left
corner of the region is defined by the colX and rowY coordinates. The width and height parameters specify the dimensions
of the rectangular region. The new values to be assigned to the pixels in this region can be specified as an array passed
to this function.
Note
Since v1.5.1, if the coordinate reference system (CRS) of the input geom geometry differs from that of the raster, then geom will be transformed to match the CRS of the raster. If the raster or geom doesn't have a CRS then it will default to 4326/WGS84.
Format without ROI geom:
RS_SetValues(raster: Raster, bandIndex: Integer, colX: Integer, rowY: Integer, width: Integer, height: Integer, newValues: ARRAY[Double], keepNoData: Boolean = false)
RS_SetValues(raster: Raster, bandIndex: Integer, colX: Integer, rowY: Integer, width: Integer, height: Integer, newValues: ARRAY[Double])
Since: v1.5.0
The colX, rowY, and bandIndex are 1-indexed. If keepNoData is true, the pixels with NoData value will not be
set to the corresponding value in newValues. The newValues should be provided in rows.
The geometry variant of this function accepts all types of Geometries, and it sets the newValue in the specified region under the geom.
The allTouched parameter (Since v1.7.1) determines how pixels are selected:
- When true, any pixel touched by the geometry will be included.
- When false (default), only pixels whose centroid intersects with the geometry will be included.
Note
If the shape of newValues doesn't match with provided width and height, IllegalArgumentException is thrown.
Note
If the mentioned bandIndex doesn't exist, this will throw an IllegalArgumentException.
Format with ROI geom:
RS_SetValues(raster: Raster, bandIndex: Integer, geom: Geometry, newValue: Double, allTouched: Boolean = false, keepNoData: Boolean = false)
RS_SetValues(raster: Raster, bandIndex: Integer, geom: Geometry, newValue: Double, allTouched: Boolean = false)
RS_SetValues(raster: Raster, bandIndex: Integer, geom: Geometry, newValue: Double)
SQL Example
SELECT RS_BandAsArray(
        RS_SetValues(
            RS_AddBandFromArray(
                RS_MakeEmptyRaster(1, 5, 5, 0, 0, 1, -1, 0, 0, 0),
                Array(1,1,1,0,0,0,1,2,3,3,5,6,7,0,0,3,0,0,3,0,0,0,0,0,0), 1, 0d
                ),
            1, 2, 2, 3, 3, [11,12,13,14,15,16,17,18,19]
            )
        )
Output:
Array(1.0, 1.0, 1.0, 0.0, 0.0, 0.0, 11.0, 12.0, 13.0, 3.0, 5.0, 14.0, 15.0, 16.0, 0.0, 3.0, 17.0, 18.0, 19.0, 0.0, 0.0, 0.0, 0.0, 0.0, 0.0)
SQL Example
SELECT RS_BandAsArray(
        RS_SetValues(
            RS_AddBandFromArray(
                RS_MakeEmptyRaster(1, 5, 5, 1, -1, 1, -1, 0, 0, 0),
                Array(0,0,0,0,0,0,0,0,0,0,0,0,0,0,0,0,0,0,0,0,0,0,0,0,0), 1
                ),
            1, ST_GeomFromWKT('POLYGON((1 -1, 3 -3, 6 -6, 4 -1, 1 -1))'), 255, false, false
            )
           )
Output:
Array(255.0, 255.0, 255.0, 0.0, 0.0, 0.0, 255.0, 255.0, 255.0, 0.0, 0.0, 0.0, 255.0, 255.0, 0.0, 0.0, 0.0, 0.0, 255.0, 0.0, 0.0, 0.0, 0.0, 0.0, 0.0)
RS_SetSRID
Introduction: Sets the spatial reference system identifier (SRID) of the raster geometry.
Format: RS_SetSRID (raster: Raster, srid: Integer)
Since: v1.4.1
SQL Example
SELECT RS_SetSRID(raster, 4326)
FROM raster_table
RS_SRID
Introduction: Returns the spatial reference system identifier (SRID) of the raster geometry.
Format: RS_SRID (raster: Raster)
Since: v1.4.1
SQL Example
SELECT RS_SRID(raster) FROM raster_table
Output:
3857
RS_Union
Introduction: Returns a combined multi-band raster from 2 or more input Rasters. The order of bands in the resultant raster will be in the order of the input rasters. For example if RS_Union is called on two 2-banded raster, raster1 and raster2, the first 2 bands of the resultant 4-banded raster will be from raster1 and the last 2 from raster 2.
Note
If the provided input Rasters don't have same shape an IllegalArgumentException will be thrown.
Format:
RS_Union (raster1: Raster, raster2: Raster)
RS_Union (raster1: Raster, raster2: Raster, raster3: Raster)
RS_Union (raster1: Raster, raster2: Raster, raster3: Raster, raster4: Raster)
RS_Union (raster1: Raster, raster2: Raster, raster3: Raster, raster4: Raster, raster5: Raster)
RS_Union (raster1: Raster, raster2: Raster, raster3: Raster, raster4: Raster, raster5: Raster, raster6: Raster)
RS_Union (raster1: Raster, raster2: Raster, raster3: Raster, raster4: Raster, raster5: Raster, raster6: Raster, raster7: Raster)
Since: v1.6.0
SQL Example
SELECT RS_Union(raster1, raster2, raster3, raster4) FROM rasters
Output:
GridCoverage2D["g...
RS_Value
Introduction: Returns the value at the given point in the raster. If no band number is specified it defaults to 1.
Note
Since v1.5.1, if the coordinate reference system (CRS) of the input point geometry differs from that of the raster, then point will be transformed to match the CRS of the raster. If the raster or point doesn't have a CRS then it will default to 4326/WGS84.
Format:
RS_Value (raster: Raster, point: Geometry)
RS_Value (raster: Raster, point: Geometry, band: Integer)
RS_Value (raster: Raster, colX: Integer, colY: Integer, band: Integer)
Since: v1.4.0
Spark SQL Examples:
- For Point Geometry:
SELECT RS_Value(raster, ST_Point(-13077301.685, 4002565.802)) FROM raster_table
- For Grid Coordinates:
SELECT RS_Value(raster, 3, 4, 1) FROM raster_table
Output:
5.0
RS_Values
Introduction: Returns the values at the given points or grid coordinates in the raster. If no band number is specified it defaults to 1.
RS_Values is similar to RS_Value but operates on an array of points or grid coordinates. RS_Values can be significantly faster since a raster only has to be loaded once for several points.
Note
Since v1.5.1, if the coordinate reference system (CRS) of the input points geometries differs from that of the raster, then points will be transformed to match the CRS of the raster. If the raster or points doesn't have a CRS then it will default to 4326/WGS84.
Format:
RS_Values (raster: Raster, points: ARRAY[Geometry])
RS_Values (raster: Raster, points: ARRAY[Geometry], band: Integer)
RS_Values (raster: Raster, xCoordinates: ARRAY[Integer], yCoordinates: ARRAY[Integer], band: Integer)
Since: v1.4.0
SQL Example
- For Array of Point geometries:
SELECT RS_Values(raster, Array(ST_Point(-1307.5, 400.8), ST_Point(-1403.3, 399.1)))
FROM raster_table
- For Arrays of grid coordinates:
SELECT RS_Values(raster, Array(4, 5), Array(3, 2), 1) FROM raster_table
Output:
Array(5.0, 3.0)
Spark SQL example for joining a point dataset with a raster dataset:
val pointDf = sedona.read...
val rasterDf = sedona.read.format("binaryFile").load("/some/path/*.tiff")
  .withColumn("raster", expr("RS_FromGeoTiff(content)"))
  .withColumn("envelope", expr("RS_Envelope(raster)"))

// Join the points with the raster extent and aggregate points to arrays.
// We only use the path and envelope of the raster to keep the shuffle as small as possible.
val df = pointDf.join(rasterDf.select("path", "envelope"), expr("ST_Within(point_geom, envelope)"))
  .groupBy("path")
  .agg(collect_list("point_geom").alias("point"), collect_list("point_id").alias("id"))

df.join(rasterDf, "path")
  .selectExpr("explode(arrays_zip(id, point, RS_Values(raster, point))) as result")
  .selectExpr("result.*")
  .show()
Output:
+----+------------+-------+
| id | point      | value |
+----+------------+-------+
|  4 | POINT(1 1) |   3.0 |
|  5 | POINT(2 2) |   7.0 |
+----+------------+-------+
Raster Tiles
RS_Tile
Introduction: Returns an array of rasters resulting from the split of the input raster based upon the desired dimensions of the output rasters.
Format: RS_Tile(raster: Raster, width: Int, height: Int, padWithNoData: Boolean = false, noDataVal: Double = null)
Format: RS_Tile(raster: Raster, bandIndices: Array[Int], width: Int, height: Int, padWithNoData: Boolean = false, noDataVal: Double = null)
Since: v1.5.1
width and height specifies the size of generated tiles. If bandIndices is NULL or not specified, all bands will be included in the output tiles,
otherwise bands specified by bandIndices will be included. Band indices are 1-based.
If padWithNoData = false, edge tiles on the right and bottom sides of the raster may have different dimensions than the rest of
the tiles. If padWithNoData = true, all tiles will have the same dimensions with the possibility that edge tiles being padded with
NODATA values. If raster band(s) do not have NODATA value(s) specified, one can be specified by setting noDataVal.
SQL example:
WITH raster_table AS (SELECT RS_MakeEmptyRaster(1, 6, 6, 300, 400, 10) rast)
SELECT RS_Tile(rast, 2, 2) AS tiles FROM raster_table
Output:
+--------------------+
|               tiles|
+--------------------+
|[GridCoverage2D["...|
+--------------------+
User can use EXPLODE function to expand the array of tiles into a table of tiles.
WITH raster_table AS (SELECT RS_MakeEmptyRaster(1, 6, 6, 300, 400, 10) rast)
SELECT EXPLODE(RS_Tile(rast, 2, 2)) AS tile FROM raster_table
Output:
+--------------------+
|                tile|
+--------------------+
|GridCoverage2D["g...|
|GridCoverage2D["g...|
|GridCoverage2D["g...|
|GridCoverage2D["g...|
|GridCoverage2D["g...|
|GridCoverage2D["g...|
|GridCoverage2D["g...|
|GridCoverage2D["g...|
|GridCoverage2D["g...|
+--------------------+
RS_TileExplode
Introduction: Generates records containing raster tiles resulting from the split of the input raster based upon the desired dimensions of the output rasters.
Format: RS_TileExplode(raster: Raster, width: Int, height: Int, padWithNoData: Boolean = false, noDataVal: Double = null)
Format: RS_TileExplode(raster: Raster, bandIndex: Int, width: Int, height: Int, padWithNoData: Boolean = false, noDataVal: Double = null)
Format: RS_TileExplode(raster: Raster, bandIndices: Array[Int], width: Int, height: Int, padWithNoData: Boolean = false, noDataVal: Double = null)
Since: v1.5.0
width and height specifies the size of generated tiles. If bandIndices is NULL or not specified, all bands will be included in the output tiles,
otherwise bands specified by bandIndices will be included. bandIndex can be specified if there is only one selected band, which is equivalent to
specifying bandIndices as ARRAY(bandIndex).Band indices are 1-based.
If padWithNoData = false, edge tiles on the right and bottom sides of the raster may have different dimensions than the rest of
the tiles. If padWithNoData = true, all tiles will have the same dimensions with the possibility that edge tiles being padded with
NODATA values. If raster band(s) do not have NODATA value(s) specified, one can be specified by setting noDataVal.
The returned records have the following schema:
x: The index of the tile along X axis (0-based).y: The index of the tile along Y axis (0-based).tile: The tile.
SQL example:
WITH raster_table AS (SELECT RS_MakeEmptyRaster(1, 6, 6, 300, 400, 10) rast)
SELECT RS_TileExplode(rast, 2, 2) FROM raster_table
Output:
+---+---+--------------------+
|  x|  y|                tile|
+---+---+--------------------+
|  0|  0|GridCoverage2D["g...|
|  1|  0|GridCoverage2D["g...|
|  2|  0|GridCoverage2D["g...|
|  0|  1|GridCoverage2D["g...|
|  1|  1|GridCoverage2D["g...|
|  2|  1|GridCoverage2D["g...|
|  0|  2|GridCoverage2D["g...|
|  1|  2|GridCoverage2D["g...|
|  2|  2|GridCoverage2D["g...|
+---+---+--------------------+
Raster to Map Algebra Operators
To bridge the gap between the raster and map algebra worlds, the following operators are provided. These operators convert a raster to a map algebra object. The map algebra object can then be used with the map algebra operators described in the next section.
RS_BandAsArray
Introduction: Extract a band from a raster as an array of doubles.
Format: RS_BandAsArray (raster: Raster, bandIndex: Integer).
Since: v1.4.1
BandIndex is 1-based and must be between 1 and RS_NumBands(raster). It returns null if the bandIndex is out of range or the raster is null.
SQL Example
SELECT RS_BandAsArray(raster, 1) FROM raster_table
Output:
+--------------------+
|                band|
+--------------------+
|[0.0, 0.0, 0.0, 0...|
+--------------------+
RS_AddBandFromArray
Introduction: Add a band to a raster from an array of doubles.
Format:
RS_AddBandFromArray (raster: Raster, band: ARRAY[Double])
RS_AddBandFromArray (raster: Raster, band: ARRAY[Double], bandIndex: Integer)
RS_AddBandFromArray (raster: Raster, band: ARRAY[Double], bandIndex: Integer, noDataValue: Double)
Since: v1.5.0
The bandIndex is 1-based and must be between 1 and RS_NumBands(raster) + 1. It throws an exception if the bandIndex is out of range or the raster is null. If not specified, the noDataValue of the band is assumed to be null.
When the bandIndex is RS_NumBands(raster) + 1, it appends the band to the end of the raster. Otherwise, it replaces the existing band at the bandIndex.
If the bandIndex and noDataValue is not given, a convenience implementation adds a new band with a null noDataValue.
Adding a new band with a custom noDataValue requires bandIndex = RS_NumBands(raster) + 1 and non-null noDataValue to be explicitly specified.
Modifying or Adding a customNoDataValue is also possible by giving an existing band in RS_AddBandFromArray
In order to remove an existing noDataValue from an existing band, pass null as the noDataValue in the RS_AddBandFromArray.
Note that: bandIndex == RS_NumBands(raster) + 1 is an experimental feature and might lead to the loss of raster metadata and properties such as color models.
Note
RS_AddBandFromArray typecasts the double band values to the given datatype of the raster. This can lead to overflow values if values beyond the range of the raster's datatype are provided.
SQL Example
SELECT RS_AddBandFromArray(raster, RS_MultiplyFactor(RS_BandAsArray(RS_FromGeoTiff(content), 1), 2)) AS raster FROM raster_table
SELECT RS_AddBandFromArray(raster, RS_MultiplyFactor(RS_BandAsArray(RS_FromGeoTiff(content), 1), 2), 1) AS raster FROM raster_table
SELECT RS_AddBandFromArray(raster, RS_MultiplyFactor(RS_BandAsArray(RS_FromGeoTiff(content), 1), 2), 1, -999) AS raster FROM raster_table
Output:
+--------------------+
|              raster|
+--------------------+
|GridCoverage2D["g...|
+--------------------+
RS_MapAlgebra
Introduction: Apply a map algebra script on a raster.
Format:
RS_MapAlgebra (raster: Raster, pixelType: String, script: String)
RS_MapAlgebra (raster: Raster, pixelType: String, script: String, noDataValue: Double)
RS_MapAlgebra(rast0: Raster, rast1: Raster, pixelType: String, script: String, noDataValue: Double)
Since: v1.5.0
RS_MapAlgebra runs a script on a raster. The script is written in a map algebra language called Jiffle. The script takes a raster
as input and returns a raster of the same size as output. The script can be used to apply a map algebra expression on a raster. The input raster is named rast in the Jiffle script, and the output raster is named out.
SQL Example
Calculate the NDVI of a raster with 4 bands (R, G, B, NIR):
-- Assume that the input raster has 4 bands: R, G, B, NIR
-- rast[0] refers to the R band, rast[3] refers to the NIR band.
SELECT RS_MapAlgebra(rast, 'D', 'out = (rast[3] - rast[0]) / (rast[3] + rast[0]);') AS ndvi FROM raster_table
Output:
+--------------------+
|              raster|
+--------------------+
|GridCoverage2D["g...|
+--------------------+
Spark SQL Example for two raster input RS_MapAlgebra:
RS_MapAlgebra(rast0, rast1, 'D', 'out = rast0[0] * 0.5 + rast1[0] * 0.5;', null)
For more details and examples about RS_MapAlgebra, please refer to the Map Algebra documentation.
To learn how to write map algebra script, please refer to Jiffle language summary.
Map Algebra Operators
Map algebra operators work on a single band of a raster. Each band is represented as an array of doubles. The operators return an array of doubles.
RS_Add
Introduction: Add two spectral bands in a Geotiff image
Format: RS_Add (Band1: ARRAY[Double], Band2: ARRAY[Double])
Since: v1.1.0
SQL Example
val sumDF = spark.sql("select RS_Add(band1, band2) as sumOfBands from dataframe")
RS_Array
Introduction: Create an array that is filled by the given value
Format: RS_Array(length: Integer, value: Double)
Since: v1.1.0
SQL Example
SELECT RS_Array(height * width, 0.0)
RS_BitwiseAND
Introduction: Find Bitwise AND between two bands of Geotiff image
Format: RS_BitwiseAND (Band1: ARRAY[Double], Band2: ARRAY[Double])
Since: v1.1.0
SQL Example
val biwiseandDF = spark.sql("select RS_BitwiseAND(band1, band2) as andvalue from dataframe")
RS_BitwiseOR
Introduction: Find Bitwise OR between two bands of Geotiff image
Format: RS_BitwiseOR (Band1: ARRAY[Double], Band2: ARRAY[Double])
Since: v1.1.0
SQL Example
val biwiseorDF = spark.sql("select RS_BitwiseOR(band1, band2) as or from dataframe")
RS_CountValue
Introduction: Returns count of a particular value from a spectral band in a raster image
Format: RS_CountValue (Band1: ARRAY[Double], Target: Double)
Since: v1.1.0
SQL Example
val countDF = spark.sql("select RS_CountValue(band1, target) as count from dataframe")
RS_Divide
Introduction: Divide band1 with band2 from a geotiff image
Format: RS_Divide (Band1: ARRAY[Double], Band2: ARRAY[Double])
Since: v1.1.0
SQL Example
val multiplyDF = spark.sql("select RS_Divide(band1, band2) as divideBands from dataframe")
RS_FetchRegion
Introduction: Fetch a subset of region from given Geotiff image based on minimumX, minimumY, maximumX and maximumY index as well original height and width of image
Format:
RS_FetchRegion (Band: ARRAY[Double], coordinates: ARRAY[Integer], dimensions: ARRAY[Integer])
Since: v1.1.0
SQL Example
val region = spark.sql("select RS_FetchRegion(Band,Array(0, 0, 1, 2),Array(3, 3)) as Region from dataframe")
RS_GreaterThan
Introduction: Mask all the values with 1 which are greater than a particular target value
Format: RS_GreaterThan (Band: ARRAY[Double], Target: Double)
Since: v1.1.0
SQL Example
val greaterDF = spark.sql("select RS_GreaterThan(band, target) as maskedvalues from dataframe")
RS_GreaterThanEqual
Introduction: Mask all the values with 1 which are greater than equal to a particular target value
Format: RS_GreaterThanEqual (Band: ARRAY[Double], Target: Double)
Since: v1.1.0
SQL Example
val greaterEqualDF = spark.sql("select RS_GreaterThanEqual(band, target) as maskedvalues from dataframe")
RS_LessThan
Introduction: Mask all the values with 1 which are less than a particular target value
Format: RS_LessThan (Band: ARRAY[Double], Target: Double)
Since: v1.1.0
SQL Example
val lessDF = spark.sql("select RS_LessThan(band, target) as maskedvalues from dataframe")
RS_LessThanEqual
Introduction: Mask all the values with 1 which are less than equal to a particular target value
Format: RS_LessThanEqual (Band: ARRAY[Double], Target: Double)
Since: v1.1.0
SQL Example
val lessEqualDF = spark.sql("select RS_LessThanEqual(band, target) as maskedvalues from dataframe")
RS_LogicalDifference
Introduction: Return value from band 1 if a value in band1 and band2 are different, else return 0
Format: RS_LogicalDifference (Band1: ARRAY[Double], Band2: ARRAY[Double])
Since: v1.1.0
SQL Example
val logicalDifference = spark.sql("select RS_LogicalDifference(band1, band2) as logdifference from dataframe")
RS_LogicalOver
Introduction: Return value from band1 if it's not equal to 0, else return band2 value
Format: RS_LogicalOver (Band1: ARRAY[Double], Band2: ARRAY[Double])
Since: v1.1.0
SQL Example
val logicalOver = spark.sql("select RS_LogicalOver(band1, band2) as logover from dataframe")
RS_Mean
Introduction: Returns Mean value for a spectral band in a Geotiff image
Format: RS_Mean (Band: ARRAY[Double])
Since: v1.1.0
SQL Example
val meanDF = spark.sql("select RS_Mean(band) as mean from dataframe")
RS_Mode
Introduction: Returns Mode from a spectral band in a Geotiff image in form of an array
Format: RS_Mode (Band: ARRAY[Double])
Since: v1.1.0
SQL Example
val modeDF = spark.sql("select RS_Mode(band) as mode from dataframe")
RS_Modulo
Introduction: Find modulo of pixels with respect to a particular value
Format: RS_Modulo (Band: ARRAY[Double], Target: Double)
Since: v1.1.0
SQL Example
val moduloDF = spark.sql("select RS_Modulo(band, target) as modulo from dataframe")
RS_Multiply
Introduction: Multiply two spectral bands in a Geotiff image
Format: RS_Multiply (Band1: ARRAY[Double], Band2: ARRAY[Double])
Since: v1.1.0
SQL Example
val multiplyDF = spark.sql("select RS_Multiply(band1, band2) as multiplyBands from dataframe")
RS_MultiplyFactor
Introduction: Multiply a factor to a spectral band in a geotiff image
Format: RS_MultiplyFactor (Band1: ARRAY[Double], Factor: Double)
Since: v1.1.0
SQL Example
val multiplyFactorDF = spark.sql("select RS_MultiplyFactor(band1, 2) as multiplyfactor from dataframe")
This function only accepts integer as factor before v1.5.0.
RS_Normalize
Introduction: Normalize the value in the array to [0, 255]. Uniform arrays are set to 0 after normalization.
Format: RS_Normalize (Band: ARRAY[Double])
Since: v1.1.0
SQL Example
SELECT RS_Normalize(band)
RS_NormalizedDifference
Introduction: Returns Normalized Difference between two bands(band2 and band1) in a Geotiff image(example: NDVI, NDBI)
Format: RS_NormalizedDifference (Band1: ARRAY[Double], Band2: ARRAY[Double])
Since: v1.1.0
SQL Example
val normalizedDF = spark.sql("select RS_NormalizedDifference(band1, band2) as normdifference from dataframe")
RS_SquareRoot
Introduction: Find Square root of band values in a geotiff image
Format: RS_SquareRoot (Band: ARRAY[Double])
Since: v1.1.0
SQL Example
val rootDF = spark.sql("select RS_SquareRoot(band) as squareroot from dataframe")
RS_Subtract
Introduction: Subtract two spectral bands in a Geotiff image(band2 - band1)
Format: RS_Subtract (Band1: ARRAY[Double], Band2: ARRAY[Double])
Since: v1.1.0
SQL Example
val subtractDF = spark.sql("select RS_Subtract(band1, band2) as differenceOfOfBands from dataframe")