Raster visualization
Sedona offers some APIs to aid in easy visualization of a raster object.
Image-based visualization
Sedona offers APIs to visualize a raster in an image form. This API only works for rasters with byte data, and bands <= 4 (Grayscale - RGBA). You can check the data type of an existing raster by using RS_BandPixelType or create your own raster by passing 'B' while using RS_MakeEmptyRaster.
RS_AsBase64
Introduction: Returns a base64 encoded string of the given raster. If the datatype is integral then this function internally takes the first 4 bands as RGBA, and converts them to the PNG format, finally produces a base64 string. When the datatype is not integral, the function converts the raster to TIFF format, and then generates a base64 string. To visualize other bands, please use it together with RS_Band. You can take the resulting base64 string in an online viewer to check how the image looks like.
Warning
This is not recommended for large files.
Format:
RS_AsBase64(raster: Raster, maxWidth: Integer)
RS_AsBase64(raster: Raster)
Since: v1.5.0
SQL Example
SELECT RS_AsBase64(raster) from rasters
Output:
iVBORw0KGgoAAAA...
RS_AsImage
Introduction: Returns a HTML that when rendered using an HTML viewer or via a Jupyter Notebook, displays the raster as a square image of side length imageWidth. Optionally, an imageWidth parameter can be passed to RS_AsImage in order to increase the size of the rendered image (default: 200).
Format: RS_AsImage(raster: Raster, imageWidth: Integer = 200)
Since: v1.5.0
SQL Example
SELECT RS_AsImage(raster, 500) from rasters
SELECT RS_AsImage(raster) from rasters
Output:
"<img src=\"data:image/png;base64,iVBORw0KGgoAAAANSUhEUgAAAAUAAAAECAAAAABjWKqcAAAAIElEQVR42mPgPfGfkYUhhfcBNw+DT1KihS6DqLKztjcATWMFp9rkkJgAAAAASUVORK5CYII=\" width=\"200\" />";
Tip
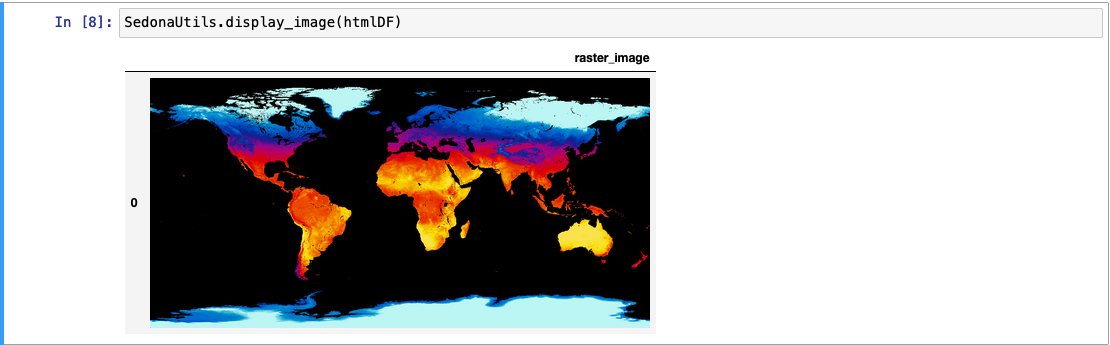
RS_AsImage can be paired with SedonaUtils.display_image(df) wrapper inside a Jupyter notebook to directly print the raster as an image in the output, where the 'df' parameter is the dataframe containing the HTML data provided by RS_AsImage
Example:
from sedona.spark import SedonaUtils

# Or from sedona.spark import *

df = (
    sedona.read.format("binaryFile")
    .load(DATA_DIR + "raster.tiff")
    .selectExpr("RS_FromGeoTiff(content) as raster")
)
htmlDF = df.selectExpr("RS_AsImage(raster, 500) as raster_image")
SedonaUtils.display_image(htmlDF)
Text-based visualization
RS_AsMatrix
Introduction: Returns a string, that when printed, outputs the raster band as a pretty printed 2D matrix. All the values of the raster are cast to double for the string. RS_AsMatrix allows specifying the number of digits to be considered after the decimal point. RS_AsMatrix expects a raster, and optionally a band (default: 1) and postDecimalPrecision (default: 6). The band parameter is 1-indexed.
Note
If the provided band is not present in the raster, RS_AsMatrix throws an IllegalArgumentException
Note
If the provided raster has integral values, postDecimalPrecision (if any) is simply ignored and integers are printed in the resultant string
Note
If you are using show() to display the output, it will show special characters as escape sequences. To get the expected behavior use the following code:
println(df.selectExpr("RS_AsMatrix(rast)").sample(0.5).collect().mkString("\n"))
System.out.println(String.join("\n", df.selectExpr("RS_AsMatrix(rast)").sample(0.5).collect()))
print("\n".join(df.selectExpr("RS_AsMatrix(rast)").sample(0.5).collect()))
The sample() function is only there to reduce the data sent to collect(), you may also use filter() if that's appropriate.
Format:
RS_AsMatrix(raster: Raster, band: Integer = 1, postDecimalPrecision: Integer = 6)
Since: 1.5.0
SQL Example
val inputDf = Seq(Seq(1, 3.333333, 4, 0.0001, 2.2222, 9, 10, 11.11111111, 3, 4, 5, 6)).toDF("band")
print(inputDf.selectExpr("RS_AsMatrix(RS_AddBandFromArray(RS_MakeEmptyRaster(1, 'd', 4, 3, 0, 0, 1, -1, 0, 0, 0), band, 1, 0))").sample(0.5).collect()(0))
Output:
| 1.00000   3.33333   4.00000   0.00010|
| 2.22220   9.00000  10.00000  11.11111|
| 3.00000   4.00000   5.00000   6.00000|
SQL Example
val inputDf = Seq(Seq(1, 3, 4, 0, 2, 9, 10, 11, 3, 4, 5, 6)).toDF("band")
print(inputDf.selectExpr("RS_AsMatrix(RS_AddBandFromArray(RS_MakeEmptyRaster(1, 'i', 4, 3, 0, 0, 1, -1, 0, 0, 0), band, 1, 0))").sample(0.5).collect()(0))
Output:
| 1   3   4   0|
| 2   9  10  11|
| 3   4   5   6|