Run GeoSpark via Zeppelin
Starting from 1.2.0, GeoSpark provides a Helium visualization plugin tailored for Apache Zeppelin. This finally bridges the gap between GeoSpark and Zeppelin. Please read Install GeoSpark-Zeppelin to learn how to install this plugin in Zeppelin.
GeoSpark-Zeppelin equips two approaches to visualize spatial data in Zeppelin. The first approach uses Zeppelin to plot all spatial objects on the map. The second one leverages GeoSparkViz to generate map images and overlay them on maps.
Small-scale without GeoSparkViz
Danger
Zeppelin is just a front-end visualization framework. This approach is not scalable and will fail at large-scale geospatial data. Please scroll down to read GeoSparkViz solution.
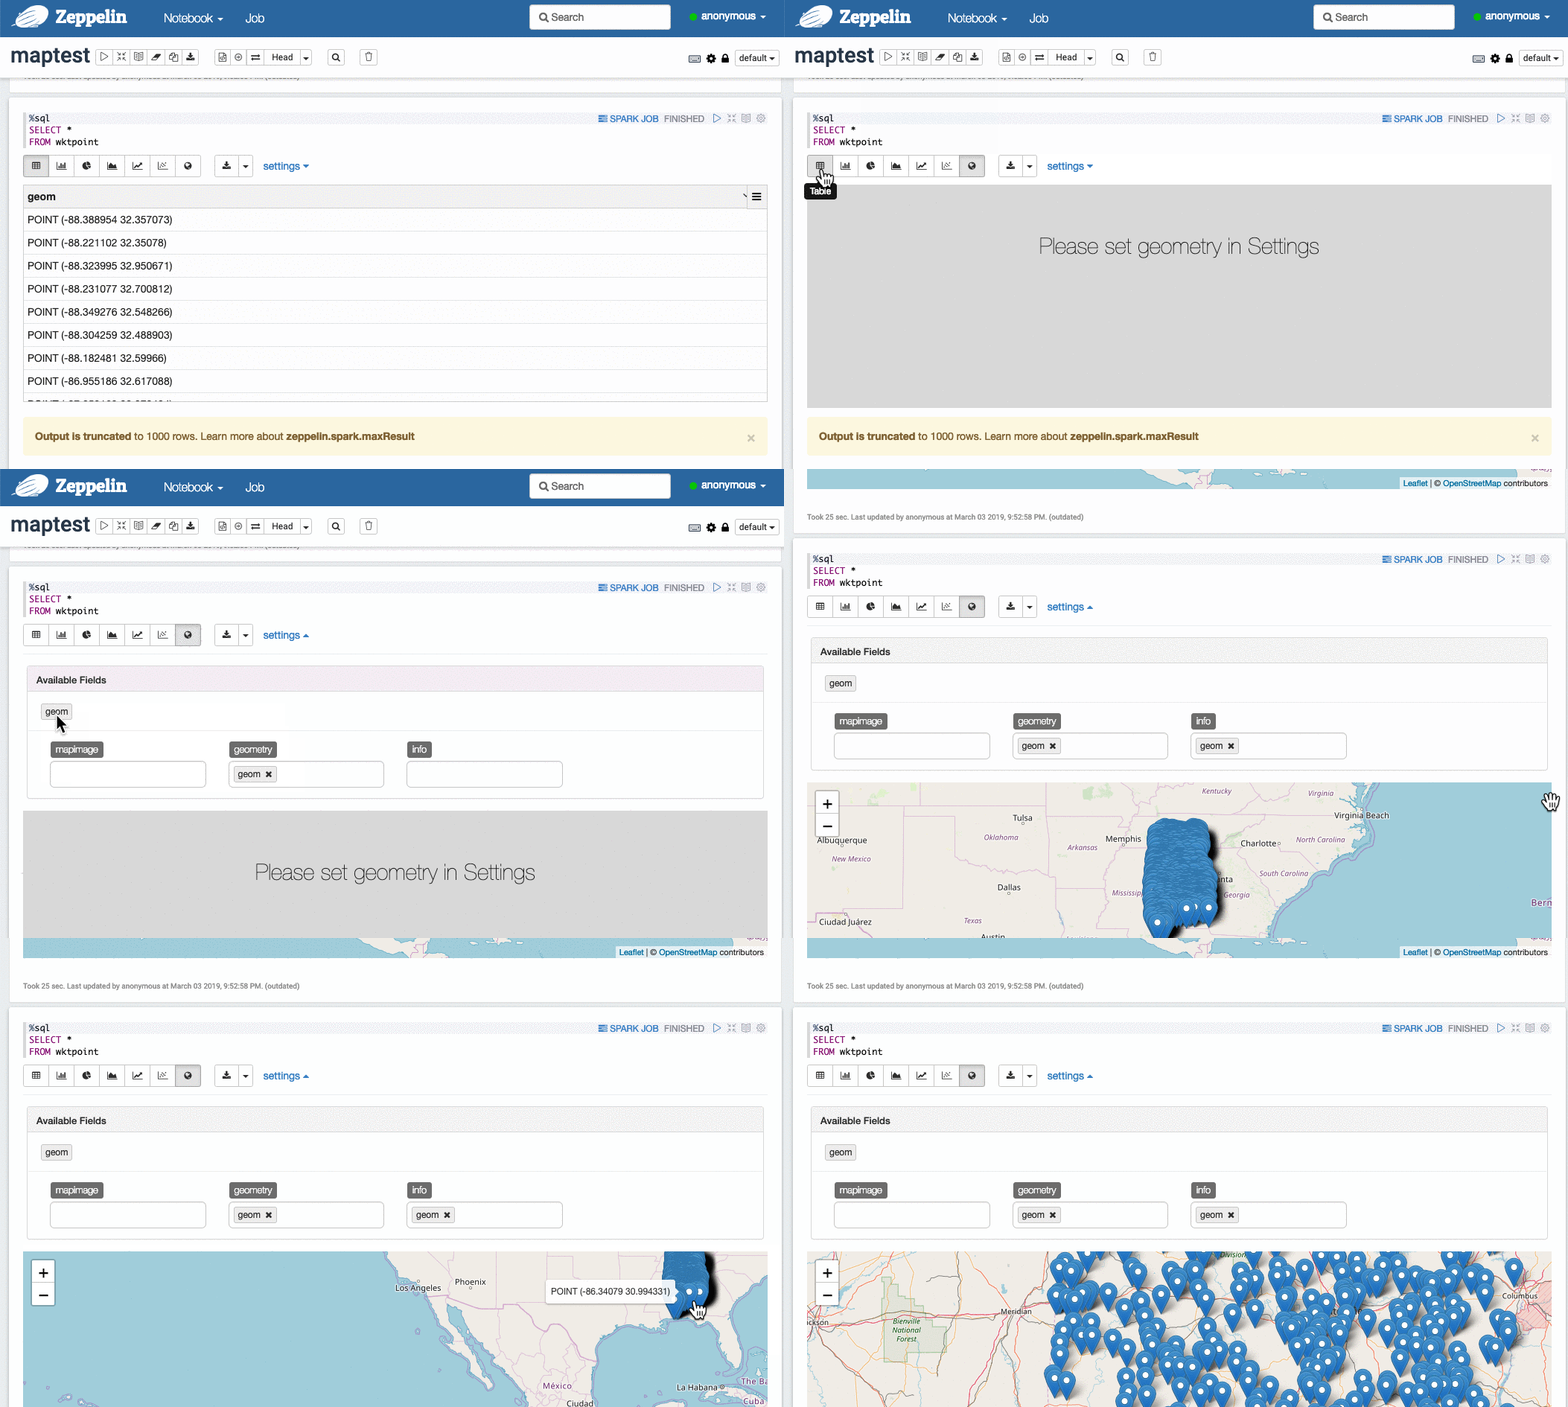
You can use Apache Zeppelin to plot a small number of spatial objects, such as 1000 points. Assume you already have a Spatial DataFrame, you need to convert the geometry column to WKT string column use the following command in your Zeppelin Spark notebook Scala paragraph:
spark.sql(
  """
    |CREATE OR REPLACE TEMP VIEW wktpoint AS
    |SELECT ST_AsText(shape) as geom
    |FROM pointtable
  """.stripMargin)
Then create an SQL paragraph to fetch the data
%sql
SELECT *
FROM wktpoint
Select the geometry column to visualize:

Large-scale with GeoSparkViz
GeoSparkViz is a distributed visualization system that allows you to visualize big spatial data at scale. Please read How to use GeoSparkViz.
You can use GeoSpark-Zeppelin to ask Zeppelin to overlay GeoSparkViz images on a map background. This way, you can easily visualize 1 billion spatial objects or more (depends on your cluster size).
First, encode images of GeoSparkViz DataFrame in Zeppelin Spark notebook Scala paragraph,
spark.sql(
  """
    |CREATE OR REPLACE TEMP VIEW images AS
    |SELECT ST_EncodeImage(image) AS image, (SELECT ST_AsText(bound) FROM boundtable) AS boundary
    |FROM images
  """.stripMargin)
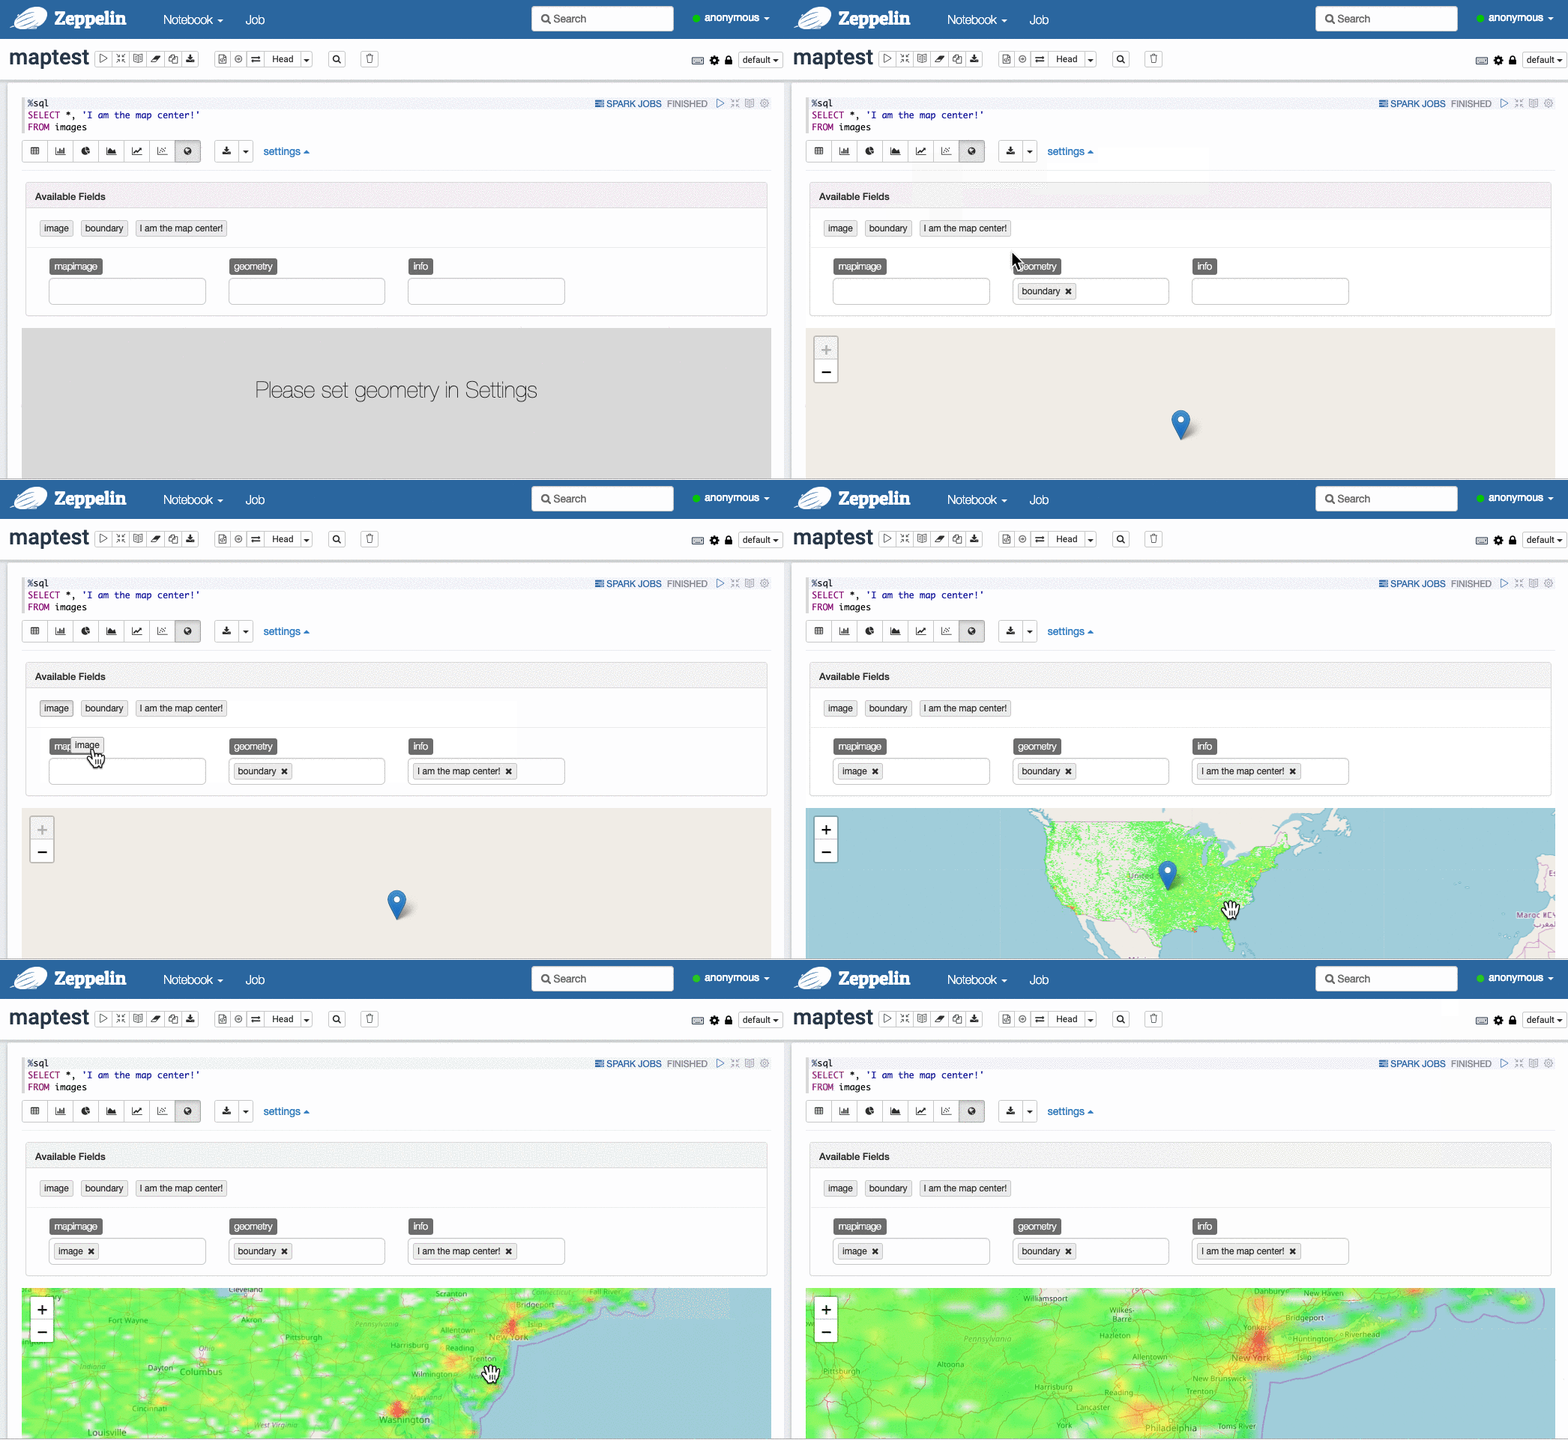
Then create an SQL paragraph to fetch the data
%sql
SELECT *, 'I am the map center!'
FROM images
Select the image and its geospatial boundary:

Zeppelin Spark notebook demo
We provide a full Zeppelin Spark notebook which demonstrates al functions. Please download GeoSpark-Zeppelin notebook template and test data - arealm.csv.
You need to use Zeppelin to import this notebook JSON file and modify the input data path in the notebook.