Raster operators
Pixel Functions
RS_PixelAsCentroid
Introduction: Returns the centroid (point geometry) of the specified pixel's area.
The pixel coordinates specified are 1-indexed.
If colX and rowY are out of bounds for the raster, they are interpolated assuming the same skew and translate values.
Format: RS_PixelAsCentroid(raster: Raster, colX: Integer, rowY: Integer)
Since: v1.5.0
Spark SQL Example:
SELECT ST_AsText(RS_PixelAsPolygon(RS_MakeEmptyRaster(1, 12, 13, 134, -53, 9), 3, 3))
Output:
POINT (156.5 -75.5)
RS_PixelAsPoint
Introduction: Returns a point geometry of the specified pixel's upper-left corner. The pixel coordinates specified are 1-indexed.
Note
If the pixel coordinates specified do not exist in the raster (out of bounds), RS_PixelAsPoint throws an IndexOutOfBoundsException.
Format: RS_PixelAsPoint(raster: Raster, colX: Integer, rowY: Integer)
Since: v1.5.0
Spark SQL Example:
SELECT ST_AsText(RS_PixelAsPoint(raster, 2, 1)) from rasters
Output:
POINT (123.19, -12)
Spark SQL Example:
SELECT ST_AsText(RS_PixelAsPoint(raster, 6, 2)) from rasters
Output:
IndexOutOfBoundsException: Specified pixel coordinates (6, 2) do not lie in the raster
RS_PixelAsPolygon
Introduction: Returns a polygon geometry that bounds the specified pixel.
The pixel coordinates specified are 1-indexed.
If colX and rowY are out of bounds for the raster, they are interpolated assuming the same skew and translate values.
Format: RS_PixelAsPolygon(raster: Raster, colX: Integer, rowY: Integer)
Since: v1.5.0
Spark SQL Example:
SELECT ST_AsText(RS_PixelAsPolygon(RS_MakeEmptyRaster(1, 5, 10, 123, -230, 8), 2, 3))
Output:
POLYGON ((131 -246, 139 -246, 139 -254, 131 -254, 131 -246))
Geometry Functions
RS_Envelope
Introduction: Returns the envelope of the raster as a Geometry.
Format: RS_Envelope (raster: Raster)
Since: v1.4.0
Spark SQL Example:
SELECT RS_Envelope(raster) FROM raster_table
Output:
POLYGON ((0 0,20 0,20 60,0 60,0 0))
RS_ConvexHull
Introduction: Return the convex hull geometry of the raster including the NoDataBandValue band pixels. For regular shaped and non-skewed rasters, this gives more or less the same result as RS_Envelope and hence is only useful for irregularly shaped or skewed rasters.
Format: RS_ConvexHull(raster: Raster)
Since: v1.5.0
Spark SQL Example:
SELECT RS_ConvexHull(RS_MakeEmptyRaster(1, 5, 10, 156, -132, 5, 10, 3, 5, 0));
Output:
POLYGON ((156 -132, 181 -107, 211 -7, 186 -32, 156 -132))
RS_MinConvexHull
Introduction: Returns the min convex hull geometry of the raster excluding the NoDataBandValue band pixels, in the given band. If no band is specified, all the bands are considered when creating the min convex hull of the raster. The created geometry representing the min convex hull has world coordinates of the raster in its CRS as the corner coordinates.
Note
If the specified band does not exist in the raster, RS_MinConvexHull throws an IllegalArgumentException
Format:
RS_MinConvexHull(raster: Raster)
RS_MinConvexHull(raster: Raster, band: Integer)
Since: v1.5.0
Spark SQL Example:
val inputDf = Seq((Seq(0, 0, 0, 0, 0, 0, 0, 0, 1, 0, 0, 1, 0, 0, 0, 0, 0, 0, 0, 0, 1, 0, 0, 0, 0),
        Seq(0, 0, 0, 0, 0, 0, 1, 0, 1, 0, 0, 0, 0, 0, 0, 0, 0, 0, 0, 0, 0, 0, 1, 1, 0))).toDF("values2", "values1")
inputDf.selectExpr("ST_AsText(RS_MinConvexHull(RS_AddBandFromArray(" +
        "RS_AddBandFromArray(RS_MakeEmptyRaster(2, 5, 5, 0, 0, 1, -1, 0, 0, 0), values1, 1, 0), values2, 2, 0))) as minConvexHullAll").show()
Output:
+----------------------------------------+
|minConvexHullAll                        |
+----------------------------------------+
|POLYGON ((0 -1, 4 -1, 4 -5, 0 -5, 0 -1))|
+----------------------------------------+
Spark SQL Example:
val inputDf = Seq((Seq(0, 0, 0, 0, 0, 0, 0, 0, 1, 0, 0, 1, 0, 0, 0, 0, 0, 0, 0, 0, 1, 0, 0, 0, 0),
        Seq(0, 0, 0, 0, 0, 0, 1, 0, 1, 0, 0, 0, 0, 0, 0, 0, 0, 0, 0, 0, 0, 0, 1, 1, 0))).toDF("values2", "values1")
inputDf.selectExpr("ST_AsText(RS_MinConvexHull(RS_AddBandFromArray(" +
  "RS_AddBandFromArray(RS_MakeEmptyRaster(2, 5, 5, 0, 0, 1, -1, 0, 0, 0), values1, 1, 0), values2, 2, 0), 1)) as minConvexHull1").show()
Output:
+----------------------------------------+
|minConvexHull1                          |
+----------------------------------------+
|POLYGON ((1 -1, 4 -1, 4 -5, 1 -5, 1 -1))|
+----------------------------------------+
Spark SQL Example:
SELECT RS_MinConvexHull(raster, 3) from rasters;
Output:
Provided band index 3 does not lie in the raster
Raster Accessors
RS_GeoReference
Introduction: Returns the georeference metadata of raster as a string in GDAL or ESRI format. Default is GDAL if not specified.
Note
If you are using show() to display the output, it will show special characters as escape sequences. To get the expected behavior use the following code:
println(df.selectExpr("RS_GeoReference(rast)").sample(0.5).collect().mkString("\n"))
System.out.println(String.join("\n", df.selectExpr("RS_GeoReference(rast)").sample(0.5).collect()))
print("\n".join(df.selectExpr("RS_GeoReference(rast)").sample(0.5).collect()))
The sample() function is only there to reduce the data sent to collect(), you may also use filter() if that's appropriate.
Format: RS_GeoReference(raster: Raster, format: String = "GDAL")
Since: v1.5.0
Difference between format representation is as follows:
GDAL
ScaleX
SkewY
SkewX
ScaleY
UpperLeftX
UpperLeftY
ESRI
ScaleX
SkewY
SkewX
ScaleY
UpperLeftX + ScaleX * 0.5
UpperLeftY + ScaleY * 0.5
Spark SQL Example:
SELECT RS_GeoReference(ST_MakeEmptyRaster(1, 100, 100, -53, 51, 2, -2, 4, 5, 4326))
Output:
2.000000
5.000000
4.000000
-2.000000
-53.000000
51.000000
Spark SQL Example:
SELECT RS_GeoReferrence(ST_MakeEmptyRaster(1, 3, 4, 100.0, 200.0,2.0, -3.0, 0.1, 0.2, 0), "GDAL")
Output:
2.000000
0.200000
0.100000
-3.000000
100.000000
200.000000
Spark SQL Example:
SELECT RS_GeoReferrence(ST_MakeEmptyRaster(1, 3, 4, 100.0, 200.0,2.0, -3.0, 0.1, 0.2, 0), "ERSI")
2.000000
0.200000
0.100000
-3.000000
101.000000
198.500000
RS_GeoTransform
Introduction: Returns an array of parameters that represent the GeoTranformation of the raster. The array contains the following values:
- 0: pixel width along west-east axis (x axis)
- 1: pixel height along north-south axis (y axis)
- 2: Rotation of the raster
- 3: Angular separation between x axis and y axis
- 4: X ordinate of upper-left coordinate
- 5: Y ordinate of upper-left coordinate
Note
Refer to this image for a clear understanding between i & j axis and x & y axis.
Format: RS_GeoTransform(raster: Raster)
Since: v1.5.1
Spark SQL Example:
SELECT RS_GeoTransform(
        RS_MakeEmptyRaster(2, 10, 15, 1, 2, 1, -2, 1, 2, 0)
       )
Output:
[2.23606797749979, 2.23606797749979, -1.1071487177940904, -2.214297435588181, 1.0, 2.0]
RS_Height
Introduction: Returns the height of the raster.
Format: RS_Height(raster: Raster)
Since: v1.5.0
Spark SQL Example:
SELECT RS_Height(raster) FROM rasters
Output:
512
RS_RasterToWorldCoordX
Introduction: Returns the upper left X coordinate of the given row and column of the given raster geometric units of the geo-referenced raster. If any out of bounds values are given, the X coordinate of the assumed point considering existing raster pixel size and skew values will be returned.
Format: RS_RasterToWorldCoordX(raster: Raster, colX: Integer, rowY: Integer)
Since: v1.5.0
Spark SQL Example:
SELECT RS_RasterToWorldCoordX(ST_MakeEmptyRaster(1, 5, 10, -123, 54, 5, -10, 0, 0, 4326), 1, 1) from rasters
Output:
-123
RS_RasterToWorldCoordY
Introduction: Returns the upper left Y coordinate of the given row and column of the given raster geometric units of the geo-referenced raster. If any out of bounds values are given, the Y coordinate of the assumed point considering existing raster pixel size and skew values will be returned.
Format: RS_RasterToWorldCoordY(raster: Raster, colX: Integer, rowY: Integer)
Since: v1.5.0
Spark SQL Example:
SELECT RS_RasterToWorldCoordY(ST_MakeEmptyRaster(1, 5, 10, -123, 54, 5, -10, 0, 0, 4326), 1, 1) from rasters
Output:
54
RS_Rotation
Introduction: Returns the uniform rotation of the raster in radian.
Format: RS_Rotation(raster: Raster)
Since: v1.5.1
Spark SQL Example:
SELECT RS_Rotation(
        RS_MakeEmptyRaster(2, 10, 15, 1, 2, 1, -2, 1, 2, 0)
        )
Output:
-1.1071487177940904
RS_ScaleX
Introduction: Returns the pixel width of the raster in CRS units.
Note
RS_ScaleX attempts to get an Affine transform on the grid in order to return scaleX (See World File for more details). If the transform on the geometry is not an Affine transform, RS_ScaleX will throw an UnsupportedException:
UnsupportedOperationException("Only AffineTransform2D is supported")
Format: RS_ScaleX(raster: Raster)
Since: v1.5.0
Spark SQL Example:
SELECT RS_ScaleX(raster) FROM rasters
Output:
1
RS_ScaleY
Introduction: Returns the pixel height of the raster in CRS units.
Note
RS_ScaleY attempts to get an Affine transform on the grid in order to return scaleX (See World File for more details). If the transform on the geometry is not an Affine transform, RS_ScaleY will throw an UnsupportedException:
UnsupportedOperationException("Only AffineTransform2D is supported")
Format: RS_ScaleY(raster: Raster)
Since: v1.5.0
Spark SQL Example:
SELECT RS_ScaleY(raster) FROM rasters
Output:
-2
RS_SkewX
Introduction: Returns the X skew or rotation parameter.
Format: RS_SkewX(raster: Raster)
Since: v1.5.0
Spark SQL Example:
SELECT RS_SkewX(RS_MakeEmptyRaster(2, 10, 10, 0.0, 0.0, 1.0, -1.0, 0.1, 0.2, 4326))
Output:
0.1
RS_SkewY
Introduction: Returns the Y skew or rotation parameter.
Format: RS_SkewY(raster: Raster)
Since: v1.5.0
Spark SQL Example:
SELECT RS_SkewY(RS_MakeEmptyRaster(2, 10, 10, 0.0, 0.0, 1.0, -1.0, 0.1, 0.2, 4326))
Output:
0.2
RS_UpperLeftX
Introduction: Returns the X coordinate of the upper-left corner of the raster.
Format: RS_UpperLeftX(raster: Raster)
Since: v1.5.0
Spark SQL Example:
SELECT RS_UpperLeftX(raster) FROM rasters
Output:
5
RS_UpperLeftY
Introduction: Returns the Y coordinate of the upper-left corner of the raster.
Format: RS_UpperLeftY(raster: Raster)
Since: v1.5.0
Spark SQL Example:
SELECT RS_UpperLeftY(raster) FROM rasters
Output:
6
RS_Width
Introduction: Returns the width of the raster.
Format: RS_Width(raster: Raster)
Since: v1.5.0
Spark SQL Example:
SELECT RS_Width(raster) FROM rasters
Output:
517
RS_WorldToRasterCoord
Introduction: Returns the grid coordinate of the given world coordinates as a Point.
Format:
RS_WorldToRasterCoord(raster: Raster, point: Geometry)
RS_WorldToRasterCoord(raster: Raster, x: Double, y: Point)
Since: v1.5.0
Spark SQL Example:
SELECT RS_WorldToRasterCoord(ST_MakeEmptyRaster(1, 5, 5, -53, 51, 1, -1, 0, 0, 4326), -53, 51) from rasters;
Output:
POINT (1 1)
Spark SQL Example:
SELECT RS_WorldToRasterCoord(ST_MakeEmptyRaster(1, 5, 5, -53, 51, 1, -1, 0, 0, 4326), ST_GeomFromText('POINT (-52 51)')) from rasters;
Output:
POINT (2 1)
Note
If the given geometry point is not in the same CRS as the given raster, the given geometry will be transformed to the given raster's CRS. You can use ST_Transform to transform the geometry beforehand.
RS_WorldToRasterCoordX
Introduction: Returns the X coordinate of the grid coordinate of the given world coordinates as an integer.
Format:
RS_WorldToRasterCoord(raster: Raster, point: Geometry)
RS_WorldToRasterCoord(raster: Raster, x: Double, y: Double)
Since: v1.5.0
Spark SQL Example:
SELECT RS_WorldToRasterCoordX(ST_MakeEmptyRaster(1, 5, 5, -53, 51, 1, -1, 0, 0), -53, 51) from rasters;
Output:
1
Spark SQL Example:
SELECT RS_WorldToRasterCoordX(ST_MakeEmptyRaster(1, 5, 5, -53, 51, 1, -1, 0, 0), ST_GeomFromText('POINT (-53 51)')) from rasters;
Output:
1
Tip
For non-skewed rasters, you can provide any value for latitude and the intended value of world longitude, to get the desired answer
RS_WorldToRasterCoordY
Introduction: Returns the Y coordinate of the grid coordinate of the given world coordinates as an integer.
Format:
RS_WorldToRasterCoordY(raster: Raster, point: Geometry)
RS_WorldToRasterCoordY(raster: Raster, x: Double, y: Double)
Since: v1.5.0
Spark SQL Example:
SELECT RS_WorldToRasterCoordY(ST_MakeEmptyRaster(1, 5, 5, -53, 51, 1, -1, 0, 0), ST_GeomFromText('POINT (-50 50)'));
Output:
2
Spark SQL Example:
SELECT RS_WorldToRasterCoordY(ST_MakeEmptyRaster(1, 5, 5, -53, 51, 1, -1, 0, 0), -50, 49);
Output:
3
Tip
For non-skewed rasters, you can provide any value for longitude and the intended value of world latitude, to get the desired answer
Raster Band Accessors
RS_Band
Introduction: Returns a new raster consisting 1 or more bands of an existing raster. It can build new rasters from existing ones, export only selected bands from a multiband raster, or rearrange the order of bands in a raster dataset.
Format:
RS_Band(raster: Raster, bands: ARRAY[Integer])
Since: v1.5.0
Spark SQL Example:
SELECT RS_NumBands(
        RS_Band(
            RS_AddBandFromArray(
                RS_MakeEmptyRaster(2, 5, 5, 3, -215, 2, -2, 2, 2, 0),
                Array(16, 0, 24, 33, 43, 49, 64, 0, 76, 77, 79, 89, 0, 116, 118, 125, 135, 0, 157, 190, 215, 229, 241, 248, 249),
                1, 0d
            ), Array(1,1,1)
        )
    )
Output:
3
RS_BandNoDataValue
Introduction: Returns the no data value of the given band of the given raster. If no band is given, band 1 is assumed. The band parameter is 1-indexed. If there is no no data value associated with the given band, RS_BandNoDataValue returns null.
Note
If the given band does not lie in the raster, RS_BandNoDataValue throws an IllegalArgumentException
Format: RS_BandNoDataValue (raster: Raster, band: Integer = 1)
Since: v1.5.0
Spark SQL Example:
SELECT RS_BandNoDataValue(raster, 1) from rasters;
Output:
0.0
Spark SQL Example:
SELECT RS_BandNoDataValue(raster) from rasters_without_nodata;
Output:
null
Spark SQL Example:
SELECT RS_BandNoDataValue(raster, 3) from rasters;
Output:
IllegalArgumentException: Provided band index 3 is not present in the raster.
RS_BandIsNoData
Returns true if the band is filled with only nodata values. Band 1 is assumed if not specified.
Format: RS_BandIsNoData(raster: Raster, band: Integer = 1)
Since: v1.5.0
Spark SQL Example:
WITH rast_table AS (SELECT RS_AddBandFromArray(RS_MakeEmptyRaster(1, 2, 2, 0, 0, 1), ARRAY(10d, 10d, 10d, 10d), 1, 10d) as rast)
SELECT RS_BandIsNoData(rast) from rast_table
Output:
true
RS_BandPixelType
Introduction: Returns the datatype of each pixel in the given band of the given raster in string format. The band parameter is 1-indexed. If no band is specified, band 1 is assumed.
Note
If the given band index does not exist in the given raster, RS_BandPixelType throws an IllegalArgumentException.
Following are the possible values returned by RS_BandPixelType:
REAL_64BITS- For Double valuesREAL_32BITS- For Float valuesSIGNED_32BITS- For Integer valuesSIGNED_16BITS- For Short valuesUNSIGNED_16BITS- For unsigned Short valuesUNSIGNED_8BITS- For Byte values
Format: RS_BandPixelType(rast: Raster, band: Integer = 1)
Since: v1.5.0
Spark SQL Example:
SELECT RS_BandPixelType(RS_MakeEmptyRaster(2, "D", 5, 5, 53, 51, 1, 1, 0, 0, 0), 2);
Output:
REAL_64BITS
SELECT RS_BandPixelType(RS_MakeEmptyRaster(2, "I", 5, 5, 53, 51, 1, 1, 0, 0, 0));
Output:
SIGNED_32BITS
SELECT RS_BandPixelType(RS_MakeEmptyRaster(2, "I", 5, 5, 53, 51, 1, 1, 0, 0, 0), 3);
Output:
IllegalArgumentException: Provided band index 3 is not present in the raster
RS_Count
Introduction: Returns the number of pixels in a given band. If band is not specified then it defaults to 1.
Note
If excludeNoDataValue is set true then it will only count pixels with value not equal to the nodata value of the raster.
Set excludeNoDataValue to false to get count of all pixels in raster.
Note
If the mentioned band index doesn't exist, this will throw an IllegalArgumentException.
Format:
RS_Count(raster: Raster, band: Integer = 1, excludeNoDataValue: Boolean = true)
RS_Count(raster: Raster, band: Integer = 1)
RS_Count(raster: Raster)
Since: v1.5.0
Spark SQL Example:
SELECT RS_Count(RS_MakeEmptyRaster(2, 5, 5, 0, 0, 1, -1, 0, 0, 0), 1, false)
Output:
25
Spark SQL Example:
SELECT RS_Count(RS_MakeEmptyRaster(2, 5, 5, 0, 0, 1, -1, 0, 0, 0), 1)
Output:
6
RS_SummaryStats
Introduction: Returns summary stats consisting of count, sum, mean, stddev, min, max for a given band in raster. If band is not specified then it defaults to 1.
Note
If excludeNoDataValue is set true then it will only count pixels with value not equal to the nodata value of the raster.
Set excludeNoDataValue to false to get count of all pixels in raster.
Note
If the mentioned band index doesn't exist, this will throw an IllegalArgumentException.
RS_SummaryStats(raster: Raster, band: Integer = 1, excludeNoDataValue: Boolean = true)
RS_SummaryStats(raster: Raster, band: Integer = 1)
RS_SummaryStats(raster: Raster)
Since: v1.5.0
Spark SQL Example:
SELECT RS_SummaryStats(RS_MakeEmptyRaster(2, 5, 5, 0, 0, 1, -1, 0, 0, 0), 1, false)
Output:
25.0, 204.0, 8.16, 9.4678403028357, 0.0, 25.0
Spark SQL Example:
SELECT RS_SummaryStats(RS_MakeEmptyRaster(2, 5, 5, 0, 0, 1, -1, 0, 0, 0), 1)
Output:
14.0, 204.0, 14.571428571428571, 11.509091348732502, 1.0, 25.0
Raster Predicates
RS_Contains
Introduction: Returns true if the geometry or raster on the left side contains the geometry or raster on the right side. The convex hull of the raster is considered in the test.
The rules for testing spatial relationship is the same as RS_Intersects.
Format:
RS_Contains(raster: Raster, geom: Geometry)
RS_Contains(geom: Geometry, raster: Raster)
RS_Contains(raster0: Raster, raster1: Raster)
Since: v1.5.0
Spark SQL Example:
SELECT RS_Contains(RS_MakeEmptyRaster(1, 20, 20, 2, 22, 1), ST_GeomFromWKT('POLYGON ((5 5, 5 10, 10 10, 10 5, 5 5))')) rast_geom,
    RS_Contains(RS_MakeEmptyRaster(1, 20, 20, 2, 22, 1), RS_MakeEmptyRaster(1, 10, 10, 2, 22, 1)) rast_rast
Output:
+---------+---------+
|rast_geom|rast_rast|
+---------+---------+
|     true|     true|
+---------+---------+
RS_Intersects
Introduction: Returns true if raster or geometry on the left side intersects with the raster or geometry on the right side. The convex hull of the raster is considered in the test.
Rules for testing spatial relationship:
- If the raster or geometry does not have a defined SRID, it is assumed to be in WGS84.
- If both sides are in the same CRS, then perform the relationship test directly.
- Otherwise, both sides will be transformed to WGS84 before the relationship test.
Format:
RS_Intersects(raster: Raster, geom: Geometry)
RS_Intersects(geom: Geometry, raster: Raster)
RS_Intersects(raster0: Raster, raster1: Raster)
Since: v1.5.0
Spark SQL Example:
SELECT RS_Intersects(RS_MakeEmptyRaster(1, 20, 20, 2, 22, 1), ST_SetSRID(ST_PolygonFromEnvelope(0, 0, 10, 10), 4326)) rast_geom,
    RS_Intersects(RS_MakeEmptyRaster(1, 20, 20, 2, 22, 1), RS_MakeEmptyRaster(1, 10, 10, 1, 11, 1)) rast_rast
Output:
+---------+---------+
|rast_geom|rast_rast|
+---------+---------+
|     true|     true|
+---------+---------+
RS_Within
Introduction: Returns true if the geometry or raster on the left side is within the geometry or raster on the right side. The convex hull of the raster is considered in the test.
The rules for testing spatial relationship is the same as RS_Intersects.
Format: RS_Within(raster: Raster, geom: Geometry)
Format: RS_Within(geom: Geometry, raster: Raster)
Format: RS_Within(raster0: Raster, raster1: Raster)
Since: v1.5.0
Spark SQL Example:
SELECT RS_Within(RS_MakeEmptyRaster(1, 20, 20, 2, 22, 1), ST_GeomFromWKT('POLYGON ((0 0, 0 50, 100 50, 100 0, 0 0))')) rast_geom,
    RS_Within(RS_MakeEmptyRaster(1, 20, 20, 2, 22, 1), RS_MakeEmptyRaster(1, 30, 30, 2, 22, 1)) rast_rast
Output:
+---------+---------+
|rast_geom|rast_rast|
+---------+---------+
|     true|     true|
+---------+---------+
Raster Based Operators
RS_AddBand
Introduction: Adds a new band to a raster toRaster at a specified index toRasterIndex. The new band's values are copied from fromRaster at a specified band index fromBand.
If no toRasterIndex is provided, the new band is appended to the end of toRaster. If no fromBand is specified, band 1 from fromRaster is copied by default.
Note
IllegalArgumentException will be thrown in these cases:
- The provided Rasters,
toRaster&fromRasterdon't have same shape. - The provided
fromBandis not infromRaster. - The provided
toRasterIndexis not in or at end oftoRaster.
Format:
RS_AddBand(toRaster: Raster, fromRaster: Raster, fromBand: Integer = 1, toRasterIndex: Integer = at_end)
RS_AddBand(toRaster: Raster, fromRaster: Raster, fromBand: Integer = 1)
RS_AddBand(toRaster: Raster, fromRaster: Raster)
Since: v1.5.0
Spark SQL Example:
SELECT RS_AddBand(raster1, raster2, 2, 1) FROM rasters
Output:
GridCoverage2D["g...
RS_Clip
Introduction: Returns a raster that is clipped by the given geometry.
If crop is not specified then it will default to true, meaning it will make the resulting raster shrink to the geometry's extent and if noDataValue is not specified then the resulting raster will have the minimum possible value for the band pixel data type.
Format:
RS_Clip(raster: Raster, band: Integer, geom: Geometry, noDataValue: Double, crop: Boolean)
RS_Clip(raster: Raster, band: Integer, geom: Geometry, noDataValue: Double)
RS_Clip(raster: Raster, band: Integer, geom: Geometry)
Since: v1.5.1
Original Raster:
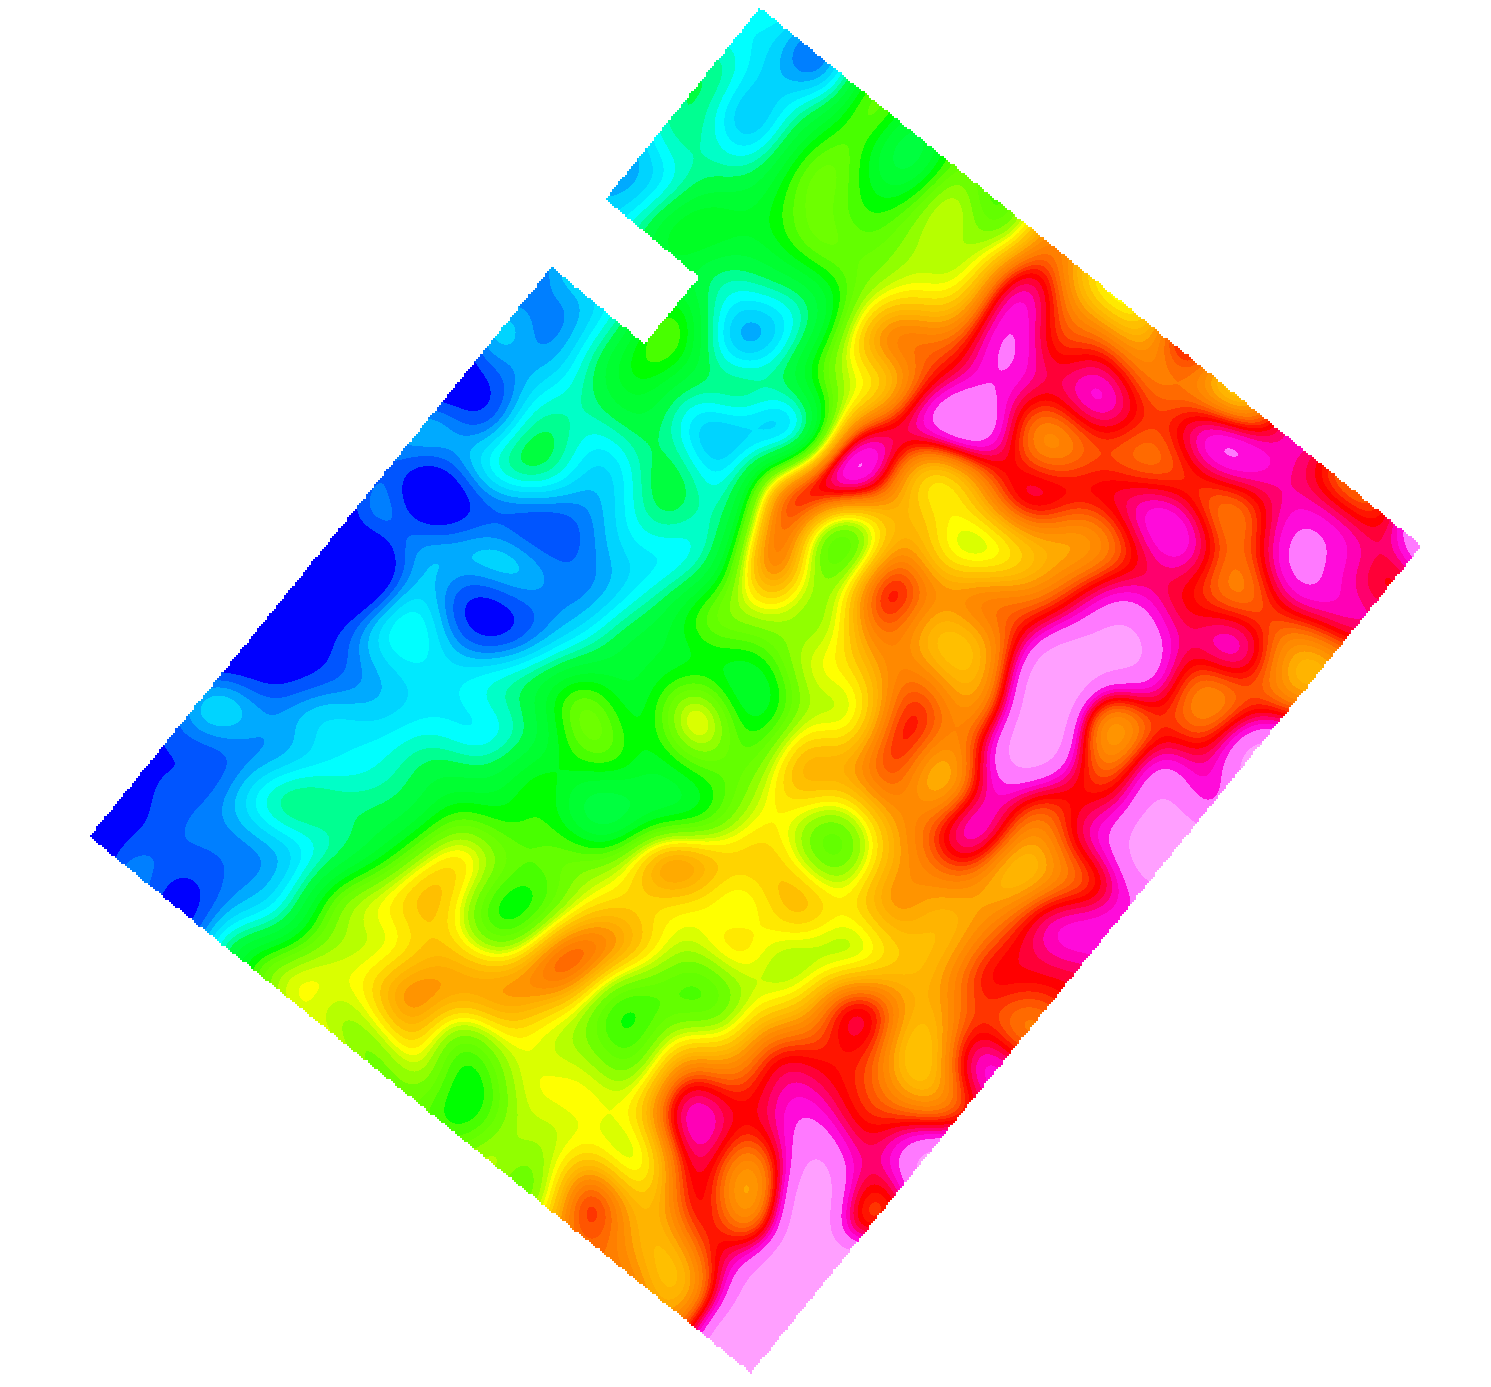
Spark SQL Example:
SELECT RS_Clip(
        RS_FromGeoTiff(content), 1,
        ST_GeomFromWKT('POLYGON ((236722 4204770, 243900 4204770, 243900 4197590, 221170 4197590, 236722 4204770))'),
        200, true
    )
Output:

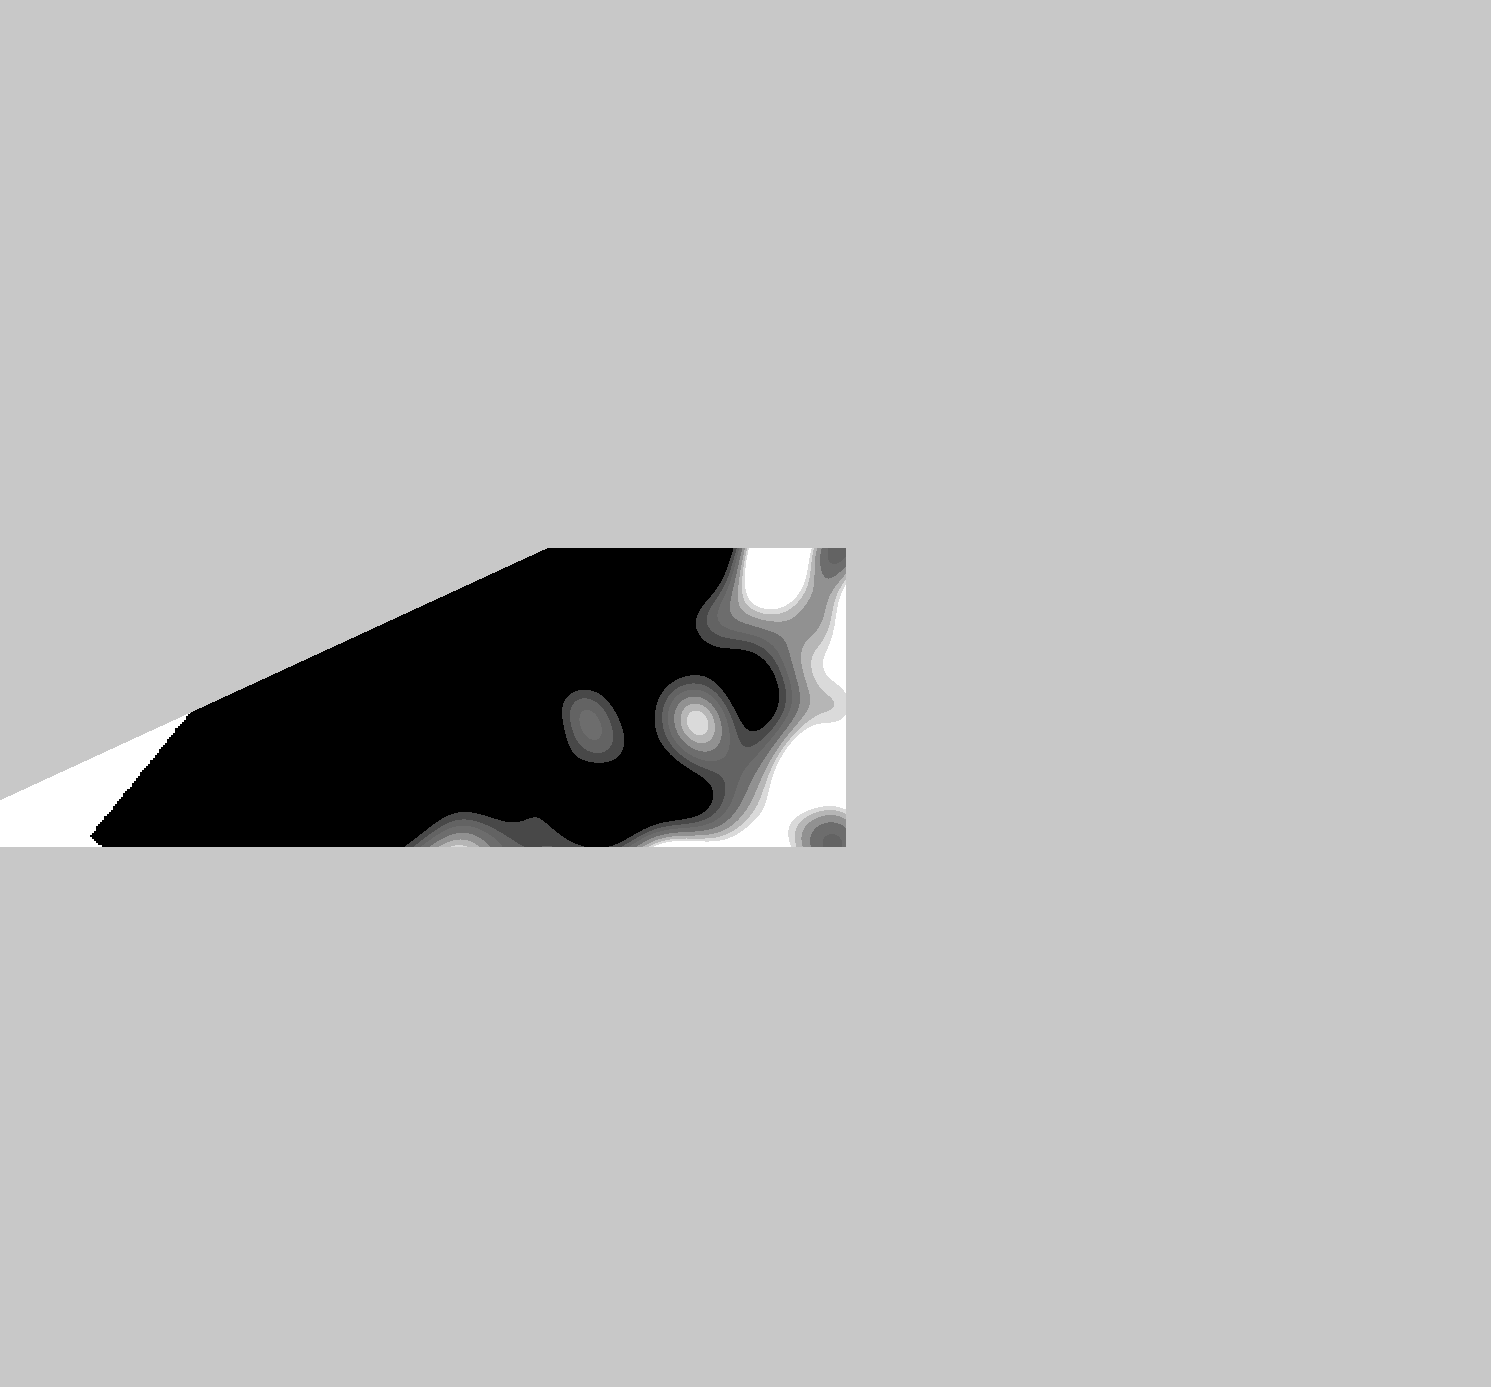
Spark SQL Example:
SELECT RS_Clip(
        RS_FromGeoTiff(content), 1,
        ST_GeomFromWKT('POLYGON ((236722 4204770, 243900 4204770, 243900 4197590, 221170 4197590, 236722 4204770))'),
        200, false
    )
Output:
RS_MetaData
Introduction: Returns the metadata of the raster as an array of double. The array contains the following values:
- 0: upper left x coordinate of the raster, in terms of CRS units
- 1: upper left y coordinate of the raster, in terms of CRS units
- 2: width of the raster, in terms of pixels
- 3: height of the raster, in terms of pixels
- 4: width of a pixel, in terms of CRS units (scaleX)
- 5: height of a pixel, in terms of CRS units (scaleY), may be negative
- 6: skew in x direction (rotation x)
- 7: skew in y direction (rotation y)
- 8: srid of the raster
- 9: number of bands
Format: RS_MetaData (raster: Raster)
Since: v1.4.1
Spark SQL Example:
SELECT RS_MetaData(raster) FROM raster_table
Output:
[-1.3095817809482181E7, 4021262.7487925636, 512.0, 517.0, 72.32861272132695, -72.32861272132695, 0.0, 0.0, 3857.0, 1.0]
RS_NumBands
Introduction: Returns the number of the bands in the raster.
Format: RS_NumBands (raster: Raster)
Since: v1.4.0
Spark SQL Example:
SELECT RS_NumBands(raster) FROM raster_table
Output:
4
RS_Resample
Introduction: Resamples a raster using a given resampling algorithm and new dimensions (width and height), a new grid corner to pivot the raster at (gridX and gridY) and a set of georeferencing attributes (scaleX and scaleY).
RS_Resample also provides an option to pass a reference raster to draw the georeferencing attributes out of. However, the SRIDs of the input and reference raster must be same, otherwise RS_Resample throws an IllegalArgumentException.
For the purpose of resampling, width-height pair and scaleX-scaleY pair are mutually exclusive, meaning any one of them can be used at a time.
The useScale parameter controls whether to use width-height or scaleX-scaleY. If useScale is false, the provided widthOrScale and heightOrScale values will be floored to integers and considered as width and height respectively (floating point width and height are not allowed). Otherwise, they are considered as scaleX and scaleY respectively.
Currently, RS_Resample does not support skewed rasters, and hence even if a skewed reference raster is provided, its skew values are ignored. If the input raster is skewed, the output raster geometry and interpolation may be incorrect.
The default algorithm used for resampling is NearestNeighbor, and hence if a null, empty or invalid value of algorithm is provided, RS_Resample defaults to using NearestNeighbor. However, the algorithm parameter is non-optional.
Following are valid values for the algorithm parameter (Case-insensitive):
- NearestNeighbor
- Bilinear
- Bicubic
Tip
If you just want to resize or rescale an input raster, you can use RS_Resample(raster: Raster, widthOrScale: Double, heightOrScale: Double, useScale: Boolean, algorithm: String)
Format:
RS_Resample(raster: Raster, widthOrScale: Double, heightOrScale: Double, gridX: Double, gridY: Double, useScale: Boolean, algorithm: String)
RS_Resample(raster: Raster, widthOrScale: Double, heightOrScale: Double, useScale: Boolean, algorithm: String)
RS_Resample(raster: Raster, referenceRaster: Raster, useScale: Boolean, algorithm: String)
Since: v1.5.0
Spark SQL Example:
WITH INPUT_RASTER AS (
 SELECT RS_AddBandFromArray(
    RS_MakeEmptyRaster(1, 'd', 4, 3, 0, 0, 2, -2, 0, 0, 0),
    ARRAY(1, 2, 3, 5, 4, 5, 6, 9, 7, 8, 9, 10), 1, null) as rast
),
RESAMPLED_RASTER AS (
 SELECT RS_Resample(rast, 6, 5, 1, -1, false, null) as resample_rast from INPUT_RASTER
)
SELECT RS_AsMatrix(resample_rast) as rast_matrix, RS_Metadata(resample_rast) as rast_metadata from RESAMPLED_RASTER
Output:
| 1.0   1.0   2.0   3.0   3.0   5.0|
| 1.0   1.0   2.0   3.0   3.0   5.0|
| 4.0   4.0   5.0   6.0   6.0   9.0|
| 7.0   7.0   8.0   9.0   9.0  10.0|
| 7.0   7.0   8.0   9.0   9.0  10.0|

(-0.33333333333333326,0.19999999999999996,6,5,1.388888888888889,-1.24,0,0,0,1)
Spark SQL Example:
 WITH INPUT_RASTER AS (
   SELECT RS_AddBandFromArray(
    RS_MakeEmptyRaster(1, 'd', 4, 3, 0, 0, 2, -2, 0, 0, 0),
    ARRAY(1, 2, 3, 5, 4, 5, 6, 9, 7, 8, 9, 10), 1, null) as rast
   ),
   RESAMPLED_RASTER AS (
    SELECT RS_Resample(rast, 1.2, -1.4, true, null) as resample_rast from INPUT_RASTER
   )
SELECT RS_AsMatrix(resample_rast) as rast_matrix, RS_Metadata(resample_rast) as rast_metadata from RESAMPLED_RASTER
Output:
|       NaN         NaN         NaN         NaN         NaN         NaN         NaN|
|       NaN    3.050000    3.650000    4.250000    5.160000    6.690000    7.200000|
|       NaN    5.150000    5.750000    6.350000    7.250000    8.750000    9.250000|
|       NaN    7.250000    7.850000    8.450000    9.070000    9.730000    9.950000|
|       NaN    7.400000    8.000000    8.600000    9.200000    9.800000   10.000000|

(0.0, 0.0, 7.0, 5.0, 1.2, -1.4, 0.0, 0.0, 0.0, 1.0)
Spark SQL Example:
WITH INPUT_RASTER AS (
    SELECT RS_AddBandFromArray(RS_MakeEmptyRaster(1, 'd', 4, 3, 0, 0, 2, -2, 0, 0, 0), ARRAY(1, 2, 3, 5, 4, 5, 6, 9, 7, 8, 9, 10), 1, null) as rast
),
REF_RASTER AS (
    SELECT RS_MakeEmptyRaster(2, 'd', 6, 5, 1, -1, 1.2, -1.4, 0, 0, 0) as ref_rast
),
RESAMPLED_RASTER AS (
    SELECT RS_Resample(rast, ref_rast, true, null) as resample_rast from INPUT_RASTER, REF_RASTER
)
SELECT RS_AsMatrix(resample_rast) as rast_matrix, RS_Metadata(resample_rast) as rast_metadata from RESAMPLED_RASTER
Output:
| 1.0   1.0   2.0   3.0   3.0   5.0   5.0|
| 1.0   1.0   2.0   3.0   3.0   5.0   5.0|
| 4.0   4.0   5.0   6.0   6.0   9.0   9.0|
| 7.0   7.0   8.0   9.0   9.0  10.0  10.0|
| 7.0   7.0   8.0   9.0   9.0  10.0  10.0|

(-0.20000000298023224, 0.4000000059604645, 7.0, 5.0, 1.2, -1.4, 0.0, 0.0, 0.0, 1.0)
RS_SetBandNoDataValue
Introduction: This sets the no data value for a specified band in the raster. If the band index is not provided, band 1 is assumed by default. Passing a null value for noDataValue will remove the no data value and that will ensure all pixels are included in functions rather than excluded as no data.
Format: RS_SetBandNoDataValue(raster: Raster, bandIndex: Integer = 1, noDataValue: Double)
Since: v1.5.0
Spark SQL Example:
SELECT RS_BandNoDataValue(
        RS_SetBandNoDataValue(
            RS_MakeEmptyRaster(1, 20, 20, 2, 22, 2, 3, 1, 1, 0),
            -999
            )
        )
Output:
-999
RS_SetGeoReference
Introduction: Sets the Georeference information of an object in a single call. Accepts inputs in GDAL and ESRI format.
Default format is GDAL. If all 6 parameters are not provided then will return null.
Format:
RS_SetGeoReference(raster: Raster, geoRefCoord: String, format: String = "GDAL")
RS_SetGeoReference(raster: Raster, upperLeftX: Double, upperLeftY: Double, scaleX: Double, scaleY: Double, skewX: Double, skewY: Double)
Since: v1.5.0
Difference between format representation is as follows:
GDAL
ScaleX SkewY SkewX ScaleY UpperLeftX UpperLeftY
ESRI
ScaleX SkewY SkewX ScaleY (UpperLeftX + ScaleX * 0.5) (UpperLeftY + ScaleY * 0.5)
Spark SQL Example:
SELECT RS_GeoReference(
        RS_SetGeoReference(
            RS_MakeEmptyRaster(1, 20, 20, 2, 22, 2, 3, 1, 1, 0),
            '3 1.5 1.5 2 22 3'
        )
    )
Output:
3.000000
1.500000
1.500000
2.000000
22.000000
3.000000
Spark SQL Example:
SELECT RS_GeoReference(
        RS_SetGeoReference(
            RS_MakeEmptyRaster(1, 20, 20, 2, 22, 2, 3, 1, 1, 0),
            '3 1.5 1.5 2 22 3', 'ESRI'
        )
    )
Output:
3.000000
1.500000
1.500000
2.000000
20.500000
2.000000
Spark SQL Example:
SELECT RS_GeoReference(
        RS_SetGeoReference(
            RS_MakeEmptyRaster(2, 5, 5, 0, 0, 1, -1, 0, 0, 0),
            8, -3, 4, 5, 0.2, 0.2
        )
    )
Output:
4.000000
0.200000
0.200000
5.000000
8.000000
-3.000000
RS_SetValue
Introduction: Returns a raster by replacing the value of pixel specified by colX and rowY.
Format:
RS_SetValue(raster: Raster, bandIndex: Integer = 1, colX: Integer, rowY: Integer, newValue: Double)
Since: v1.5.0
Spark SQL Example:
SELECT RS_BandAsArray(
               RS_SetValue(
                       RS_AddBandFromArray(
                               RS_MakeEmptyRaster(1, 5, 5, 0, 0, 1, -1, 0, 0, 0),
                           [1,1,1,0,0,0,1,2,3,3,5,6,7,0,0,3,0,0,3,0,0,0,0,0,0], 1, 0d
                           ),
                       1, 2, 2, 255
                   )
           )
Output:
[1.0, 1.0, 1.0, 0.0, 0.0, 0.0, 255.0, 2.0, 3.0, 3.0, 5.0, 6.0, 7.0, 0.0, 0.0, 3.0, 0.0, 0.0, 3.0, 0.0, 0.0, 0.0, 0.0, 0.0, 0.0]
RS_SetValues
Introduction: Returns a raster by replacing the values of pixels in a specified rectangular region. The top left
corner of the region is defined by the colX and rowY coordinates. The width and height parameters specify the dimensions
of the rectangular region. The new values to be assigned to the pixels in this region can be specified as an array passed
to this function.
Format:
RS_SetValues(raster: Raster, bandIndex: Integer, colX: Integer, rowY: Integer, width: Integer, height: Integer, newValues: ARRAY[Double], keepNoData: Boolean = false)
RS_SetValues(raster: Raster, bandIndex: Integer, geom: Geometry, newValue: Double, keepNoData: Boolean = false)
Since: v1.5.0
The colX, rowY, and bandIndex are 1-indexed. If keepNoData is true, the pixels with NoData value will not be
set to the corresponding value in newValues. The newValues should be provided in rows.
The geometry variant of this function accepts all types of Geometries and it sets the newValue in the specified region under the geom.
Note
If the shape of newValues doesn't match with provided width and height, IllegalArgumentException is thrown.
Note
If the mentioned bandIndex doesn't exist, this will throw an IllegalArgumentException.
Spark SQL Example:
SELECT RS_BandAsArray(
        RS_SetValues(
            RS_AddBandFromArray(
                RS_MakeEmptyRaster(1, 5, 5, 0, 0, 1, -1, 0, 0, 0),
                Array(1,1,1,0,0,0,1,2,3,3,5,6,7,0,0,3,0,0,3,0,0,0,0,0,0), 1, 0d
                ),
            1, 2, 2, 3, 3, [11,12,13,14,15,16,17,18,19]
            )
        )
Output:
Array(1.0, 1.0, 1.0, 0.0, 0.0, 0.0, 11.0, 12.0, 13.0, 3.0, 5.0, 14.0, 15.0, 16.0, 0.0, 3.0, 17.0, 18.0, 19.0, 0.0, 0.0, 0.0, 0.0, 0.0, 0.0)
Spark SQL Example:
SELECT RS_BandAsArray(
        RS_SetValues(
            RS_AddBandFromArray(
                RS_MakeEmptyRaster(1, 5, 5, 1, -1, 1, -1, 0, 0, 0),
                Array(0,0,0,0,0,0,0,0,0,0,0,0,0,0,0,0,0,0,0,0,0,0,0,0,0), 1
                ),
            1, ST_GeomFromWKT('POLYGON((1 -1, 3 -3, 6 -6, 4 -1, 1 -1))'), 255, false
            )
           )
Output:
Array(255.0, 255.0, 255.0, 0.0, 0.0, 0.0, 255.0, 255.0, 255.0, 0.0, 0.0, 0.0, 255.0, 255.0, 0.0, 0.0, 0.0, 0.0, 255.0, 0.0, 0.0, 0.0, 0.0, 0.0, 0.0)
RS_SetSRID
Introduction: Sets the spatial reference system identifier (SRID) of the raster geometry.
Format: RS_SetSRID (raster: Raster, srid: Integer)
Since: v1.4.1
Spark SQL Example:
SELECT RS_SetSRID(raster, 4326)
FROM raster_table
RS_SRID
Introduction: Returns the spatial reference system identifier (SRID) of the raster geometry.
Format: RS_SRID (raster: Raster)
Since: v1.4.1
Spark SQL Example:
SELECT RS_SRID(raster) FROM raster_table
Output:
3857
RS_Value
Introduction: Returns the value at the given point in the raster. If no band number is specified it defaults to 1.
Format:
RS_Value (raster: Raster, point: Geometry)
RS_Value (raster: Raster, point: Geometry, band: Integer)
Since: v1.4.0
Spark SQL Example:
SELECT RS_Value(raster, ST_Point(-13077301.685, 4002565.802)) FROM raster_table
Output:
5.0
RS_Values
Introduction: Returns the values at the given points in the raster. If no band number is specified it defaults to 1.
RS_Values is similar to RS_Value but operates on an array of points. RS_Values can be significantly faster since a raster only has to be loaded once for several points.
Format:
RS_Values (raster: Raster, points: ARRAY[Geometry])
RS_Values (raster: Raster, points: ARRAY[Geometry], band: Integer)
Since: v1.4.0
Spark SQL Example:
SELECT RS_Values(raster, Array(ST_Point(-1307.5, 400.8), ST_Point(-1403.3, 399.1)))
FROM raster_table
Output:
Array(5.0, 3.0)
Spark SQL example for joining a point dataset with a raster dataset:
val pointDf = sedona.read...
val rasterDf = sedona.read.format("binaryFile").load("/some/path/*.tiff")
  .withColumn("raster", expr("RS_FromGeoTiff(content)"))
  .withColumn("envelope", expr("RS_Envelope(raster)"))

// Join the points with the raster extent and aggregate points to arrays.
// We only use the path and envelope of the raster to keep the shuffle as small as possible.
val df = pointDf.join(rasterDf.select("path", "envelope"), expr("ST_Within(point_geom, envelope)"))
  .groupBy("path")
  .agg(collect_list("point_geom").alias("point"), collect_list("point_id").alias("id"))

df.join(rasterDf, "path")
  .selectExpr("explode(arrays_zip(id, point, RS_Values(raster, point))) as result")
  .selectExpr("result.*")
  .show()
Output:
+----+------------+-------+
| id | point      | value |
+----+------------+-------+
|  4 | POINT(1 1) |   3.0 |
|  5 | POINT(2 2) |   7.0 |
+----+------------+-------+
Raster to Map Algebra Operators
To bridge the gap between the raster and map algebra worlds, the following operators are provided. These operators convert a raster to a map algebra object. The map algebra object can then be used with the map algebra operators described in the next section.
RS_BandAsArray
Introduction: Extract a band from a raster as an array of doubles.
Format: RS_BandAsArray (raster: Raster, bandIndex: Integer).
Since: v1.4.1
BandIndex is 1-based and must be between 1 and RS_NumBands(raster). It returns null if the bandIndex is out of range or the raster is null.
Spark SQL Example:
SELECT RS_BandAsArray(raster, 1) FROM raster_table
Output:
+--------------------+
|                band|
+--------------------+
|[0.0, 0.0, 0.0, 0...|
+--------------------+
RS_AddBandFromArray
Introduction: Add a band to a raster from an array of doubles.
Format:
RS_AddBandFromArray (raster: Raster, band: ARRAY[Double])
RS_AddBandFromArray (raster: Raster, band: ARRAY[Double], bandIndex: Integer)
RS_AddBandFromArray (raster: Raster, band: ARRAY[Double], bandIndex: Integer, noDataValue: Double)
Since: v1.5.0
The bandIndex is 1-based and must be between 1 and RS_NumBands(raster) + 1. It throws an exception if the bandIndex is out of range or the raster is null. If not specified, the noDataValue of the band is assumed to be null.
When the bandIndex is RS_NumBands(raster) + 1, it appends the band to the end of the raster. Otherwise, it replaces the existing band at the bandIndex.
If the bandIndex and noDataValue is not given, a convenience implementation adds a new band with a null noDataValue.
Adding a new band with a custom noDataValue requires bandIndex = RS_NumBands(raster) + 1 and non-null noDataValue to be explicitly specified.
Modifying or Adding a customNoDataValue is also possible by giving an existing band in RS_AddBandFromArray
In order to remove an existing noDataValue from an existing band, pass null as the noDataValue in the RS_AddBandFromArray.
Note that: bandIndex == RS_NumBands(raster) + 1 is an experimental feature and might lead to the loss of raster metadata and properties such as color models.
Note
RS_AddBandFromArray typecasts the double band values to the given datatype of the raster. This can lead to overflow values if values beyond the range of the raster's datatype are provided.
Spark SQL Example:
SELECT RS_AddBandFromArray(raster, RS_MultiplyFactor(RS_BandAsArray(RS_FromGeoTiff(content), 1), 2)) AS raster FROM raster_table
SELECT RS_AddBandFromArray(raster, RS_MultiplyFactor(RS_BandAsArray(RS_FromGeoTiff(content), 1), 2), 1) AS raster FROM raster_table
SELECT RS_AddBandFromArray(raster, RS_MultiplyFactor(RS_BandAsArray(RS_FromGeoTiff(content), 1), 2), 1, -999) AS raster FROM raster_table
Output:
+--------------------+
|              raster|
+--------------------+
|GridCoverage2D["g...|
+--------------------+
RS_MapAlgebra
Introduction: Apply a map algebra script on a raster.
Format:
RS_MapAlgebra (raster: Raster, pixelType: String, script: String)
RS_MapAlgebra (raster: Raster, pixelType: String, script: String, noDataValue: Double)
Since: v1.5.0
RS_MapAlgebra runs a script on a raster. The script is written in a map algebra language called Jiffle. The script takes a raster
as input and returns a raster of the same size as output. The script can be used to apply a map algebra expression on a raster. The input raster is named rast in the Jiffle script, and the output raster is named out.
Spark SQL Example:
Calculate the NDVI of a raster with 4 bands (R, G, B, NIR):
-- Assume that the input raster has 4 bands: R, G, B, NIR
-- rast[0] refers to the R band, rast[3] refers to the NIR band.
SELECT RS_MapAlgebra(rast, 'D', 'out = (rast[3] - rast[0]) / (rast[3] + rast[0]);') AS ndvi FROM raster_table
Output:
+--------------------+
|              raster|
+--------------------+
|GridCoverage2D["g...|
+--------------------+
For more details and examples about RS_MapAlgebra, please refer to the Map Algebra documentation.
To learn how to write map algebra script, please refer to Jiffle language summary.
Map Algebra Operators
Map algebra operators work on a single band of a raster. Each band is represented as an array of doubles. The operators return an array of doubles.
RS_Add
Introduction: Add two spectral bands in a Geotiff image
Format: RS_Add (Band1: ARRAY[Double], Band2: ARRAY[Double])
Since: v1.1.0
Spark SQL Example:
val sumDF = spark.sql("select RS_Add(band1, band2) as sumOfBands from dataframe")
RS_Array
Introduction: Create an array that is filled by the given value
Format: RS_Array(length: Integer, value: Double)
Since: v1.1.0
Spark SQL Example:
SELECT RS_Array(height * width, 0.0)
RS_BitwiseAND
Introduction: Find Bitwise AND between two bands of Geotiff image
Format: RS_BitwiseAND (Band1: ARRAY[Double], Band2: ARRAY[Double])
Since: v1.1.0
Spark SQL Example:
val biwiseandDF = spark.sql("select RS_BitwiseAND(band1, band2) as andvalue from dataframe")
RS_BitwiseOR
Introduction: Find Bitwise OR between two bands of Geotiff image
Format: RS_BitwiseOR (Band1: ARRAY[Double], Band2: ARRAY[Double])
Since: v1.1.0
Spark SQL Example:
val biwiseorDF = spark.sql("select RS_BitwiseOR(band1, band2) as or from dataframe")
RS_CountValue
Introduction: Returns count of a particular value from a spectral band in a raster image
Format: RS_CountValue (Band1: ARRAY[Double], Target: Double)
Since: v1.1.0
Spark SQL Example:
val countDF = spark.sql("select RS_CountValue(band1, target) as count from dataframe")
RS_Divide
Introduction: Divide band1 with band2 from a geotiff image
Format: RS_Divide (Band1: ARRAY[Double], Band2: ARRAY[Double])
Since: v1.1.0
Spark SQL Example:
val multiplyDF = spark.sql("select RS_Divide(band1, band2) as divideBands from dataframe")
RS_FetchRegion
Introduction: Fetch a subset of region from given Geotiff image based on minimumX, minimumY, maximumX and maximumY index as well original height and width of image
Format:
RS_FetchRegion (Band: ARRAY[Double], coordinates: ARRAY[Integer], dimensions: ARRAY[Integer])
Since: v1.1.0
Spark SQL Example:
val region = spark.sql("select RS_FetchRegion(Band,Array(0, 0, 1, 2),Array(3, 3)) as Region from dataframe")
RS_GreaterThan
Introduction: Mask all the values with 1 which are greater than a particular target value
Format: RS_GreaterThan (Band: ARRAY[Double], Target: Double)
Since: v1.1.0
Spark SQL Example:
val greaterDF = spark.sql("select RS_GreaterThan(band, target) as maskedvalues from dataframe")
RS_GreaterThanEqual
Introduction: Mask all the values with 1 which are greater than equal to a particular target value
Format: RS_GreaterThanEqual (Band: ARRAY[Double], Target: Double)
Since: v1.1.0
Spark SQL Example:
val greaterEqualDF = spark.sql("select RS_GreaterThanEqual(band, target) as maskedvalues from dataframe")
RS_LessThan
Introduction: Mask all the values with 1 which are less than a particular target value
Format: RS_LessThan (Band: ARRAY[Double], Target: Double)
Since: v1.1.0
Spark SQL Example:
val lessDF = spark.sql("select RS_LessThan(band, target) as maskedvalues from dataframe")
RS_LessThanEqual
Introduction: Mask all the values with 1 which are less than equal to a particular target value
Format: RS_LessThanEqual (Band: ARRAY[Double], Target: Double)
Since: v1.1.0
Spark SQL Example:
val lessEqualDF = spark.sql("select RS_LessThanEqual(band, target) as maskedvalues from dataframe")
RS_LogicalDifference
Introduction: Return value from band 1 if a value in band1 and band2 are different, else return 0
Format: RS_LogicalDifference (Band1: ARRAY[Double], Band2: ARRAY[Double])
Since: v1.1.0
Spark SQL Example:
val logicalDifference = spark.sql("select RS_LogicalDifference(band1, band2) as logdifference from dataframe")
RS_LogicalOver
Introduction: Return value from band1 if it's not equal to 0, else return band2 value
Format: RS_LogicalOver (Band1: ARRAY[Double], Band2: ARRAY[Double])
Since: v1.1.0
Spark SQL Example:
val logicalOver = spark.sql("select RS_LogicalOver(band1, band2) as logover from dataframe")
RS_Mean
Introduction: Returns Mean value for a spectral band in a Geotiff image
Format: RS_Mean (Band: ARRAY[Double])
Since: v1.1.0
Spark SQL Example:
val meanDF = spark.sql("select RS_Mean(band) as mean from dataframe")
RS_Mode
Introduction: Returns Mode from a spectral band in a Geotiff image in form of an array
Format: RS_Mode (Band: ARRAY[Double])
Since: v1.1.0
Spark SQL Example:
val modeDF = spark.sql("select RS_Mode(band) as mode from dataframe")
RS_Modulo
Introduction: Find modulo of pixels with respect to a particular value
Format: RS_Modulo (Band: ARRAY[Double], Target: Double)
Since: v1.1.0
Spark SQL Example:
val moduloDF = spark.sql("select RS_Modulo(band, target) as modulo from dataframe")
RS_Multiply
Introduction: Multiply two spectral bands in a Geotiff image
Format: RS_Multiply (Band1: ARRAY[Double], Band2: ARRAY[Double])
Since: v1.1.0
Spark SQL Example:
val multiplyDF = spark.sql("select RS_Multiply(band1, band2) as multiplyBands from dataframe")
RS_MultiplyFactor
Introduction: Multiply a factor to a spectral band in a geotiff image
Format: RS_MultiplyFactor (Band1: ARRAY[Double], Factor: Double)
Since: v1.1.0
Spark SQL Example:
val multiplyFactorDF = spark.sql("select RS_MultiplyFactor(band1, 2) as multiplyfactor from dataframe")
This function only accepts integer as factor before v1.5.0.
RS_Normalize
Introduction: Normalize the value in the array to [0, 255]
Format: RS_Normalize (Band: ARRAY[Double])
Since: v1.1.0
Spark SQL Example:
SELECT RS_Normalize(band)
RS_NormalizedDifference
Introduction: Returns Normalized Difference between two bands(band2 and band1) in a Geotiff image(example: NDVI, NDBI)
Format: RS_NormalizedDifference (Band1: ARRAY[Double], Band2: ARRAY[Double])
Since: v1.1.0
Spark SQL Example:
val normalizedDF = spark.sql("select RS_NormalizedDifference(band1, band2) as normdifference from dataframe")
RS_SquareRoot
Introduction: Find Square root of band values in a geotiff image
Format: RS_SquareRoot (Band: ARRAY[Double])
Since: v1.1.0
Spark SQL Example:
val rootDF = spark.sql("select RS_SquareRoot(band) as squareroot from dataframe")
RS_Subtract
Introduction: Subtract two spectral bands in a Geotiff image(band2 - band1)
Format: RS_Subtract (Band1: ARRAY[Double], Band2: ARRAY[Double])
Since: v1.1.0
Spark SQL Example:
val subtractDF = spark.sql("select RS_Subtract(band1, band2) as differenceOfOfBands from dataframe")